
Build Your Own Reddit Analytics Dashboard From the API: Subreddit Analytics Without a Third-Party Tool
Which endpoints to poll, how often, what to store, and how to compute the five metrics that matter. With measured latency, payload sizes and a call budget from a live pass.

Reddit does not have an analytics API.
TL;DR: A Reddit analytics dashboard is a polling loop, two tables and five formulas. Size comes from the subreddit about record; everything else is derived from post listings you store yourself. Polling cadence is the decision that governs the build and it cannot be one number, because a page of 100 posts covered 16.6 hours in r/SaaS and 2,639.4 hours in r/redditdev when we measured on 2026-08-31, a 159x spread. Tracking 20 communities every 15 minutes costs 1,940 calls a day, about 1.35% of a 100-request-per-minute budget. A 100-post listing took a median 3,015 ms, which is why the dashboard reads your database and never the API.
There is no endpoint that returns a subreddit's growth curve, no call for posts per day, and no aggregate metrics surface of any kind beyond the subscriber count sitting on the about record. The weekly visitor and contributor numbers a moderator sees in their own tooling are not exposed publicly, which a direct question in r/redditdev settled.
So a Reddit analytics dashboard is not an integration. It is a small data pipeline: a polling loop, two tables, and five formulas. This guide is the build, with the numbers measured rather than estimated. We ran a live pass on 2026-08-31 across five communities and 500 posts, timed every endpoint five times, and computed the call budget from the cadence rather than guessing at it. Every figure below says whether it was measured, derived, or published by someone else.
Not affiliated with Reddit Inc. redditapis.com is an independent third-party REST proxy for Reddit's API. This guide is vendor-neutral about the category: it says plainly where a homegrown dashboard beats a hosted tool and where it does not, and it names the limits of our own measurements.
TL;DR
A Reddit analytics dashboard is a polling loop, a table, and five formulas. Reddit has no analytics endpoint and no push channel, so everything you want is derived from two calls: the subreddit about record for size, and the post listing for everything else. The single decision that governs the whole build is polling cadence, and it cannot be one number, because a page of 100 posts covers 16.6 hours in r/SaaS and 2,639.4 hours in r/redditdev, a 159x spread we measured on 2026-08-31. Tracking 20 communities every 15 minutes costs 1,940 API calls a day, which is 1.35% of a 100-request-per-minute budget, so cost is almost never the constraint. Latency is: a 100-post listing took a median 3,015 ms across five calls, and sitewide search took 4,088 ms, which is why a dashboard reads from your database and never from the API. The metric most likely to be wrong is top-hour-of-day, because AutoModerator wrote 31 of 100 posts in r/Python and shifts its apparent peak by twelve hours.
What does a Reddit analytics dashboard actually compute?
Five metrics cover almost every real question, and four of them come from a single endpoint. Subreddit growth tracks whether a community is gaining members. Post velocity tracks how much is being submitted. Top hour of day tracks when the community is active. Comment-to-upvote ratio tracks whether posts start conversations or just collect votes. Engagement decay tracks how quickly a post stops accumulating attention.
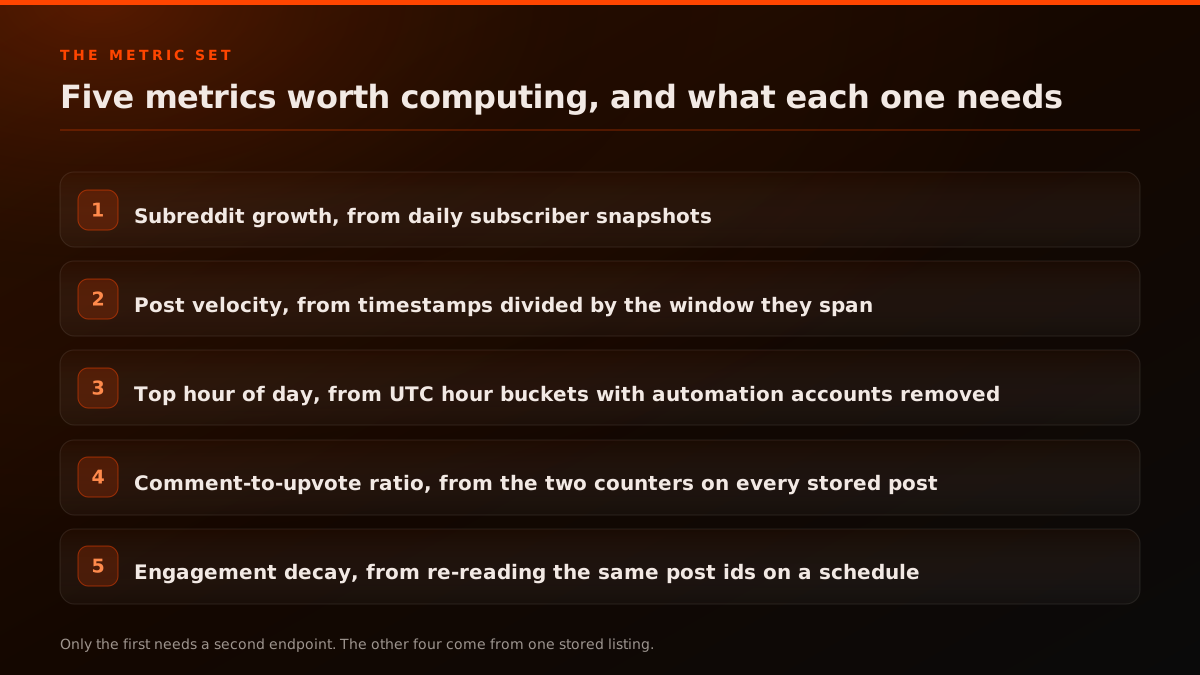
Only the first needs the about record. The other four are all derived from post listings you have already stored, which is why the storage design matters more than the endpoint choice.
The five metrics, what each reads and what it must retain
| Metric | Source call | Needs history | Formula | Most common error | Source |
|---|---|---|---|---|---|
| Subreddit growth | About record | Yes | subscribers now minus subscribers at t minus 1 | Storing a null as zero | derived |
| Post velocity | Listing | No | post count divided by window span in days | Using calendar days instead of the measured window | derived |
| Top hour of day | Listing | No | mode of UTC hour over created_utc | Counting scheduled bot posts | derived |
| Comment-to-upvote ratio | Listing | No | sum of comments over sum of upvotes | Averaging per-post ratios instead | derived |
| Engagement decay | Listing, re-read | Yes | score at t minus score at creation, per offset | Reading each post only once | derived |
That table is the whole specification. Everything after this is the implementation of those five rows, and the reason each error in the last column happens.
Read as a dependency question rather than a list, it collapses into three columns:
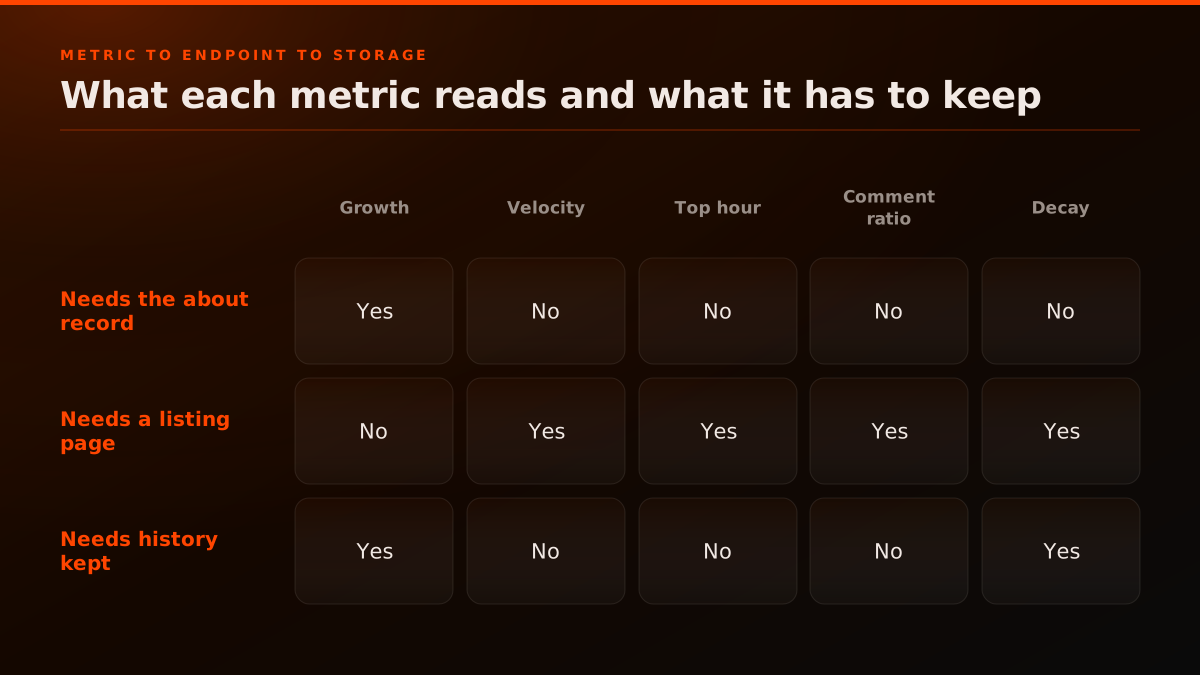
What every metric reads, and what it never reads
Only growth needs the about record. Only growth and decay need history retained, which means the other three can be computed from a single fresh pull and are therefore the ones you can ship on day one. That is the natural build order: velocity, top hour and comment ratio first, because they work immediately, then growth and decay once you have been collecting long enough for a delta to mean anything.
If you are still deciding whether to build at all rather than buy something, the comparison of hosted subreddit analytics options covers which access paths return which fields, and is the better starting point for that question. This guide assumes you have made the decision and want the pipeline.
Which endpoints does a subreddit analytics dashboard need?
Two, plus a third if you want sitewide keyword coverage. The about record gives you the subscriber count. The post listing gives you everything else. Sitewide search gives you mentions outside the communities you track, at a cost worth knowing about before you add it.
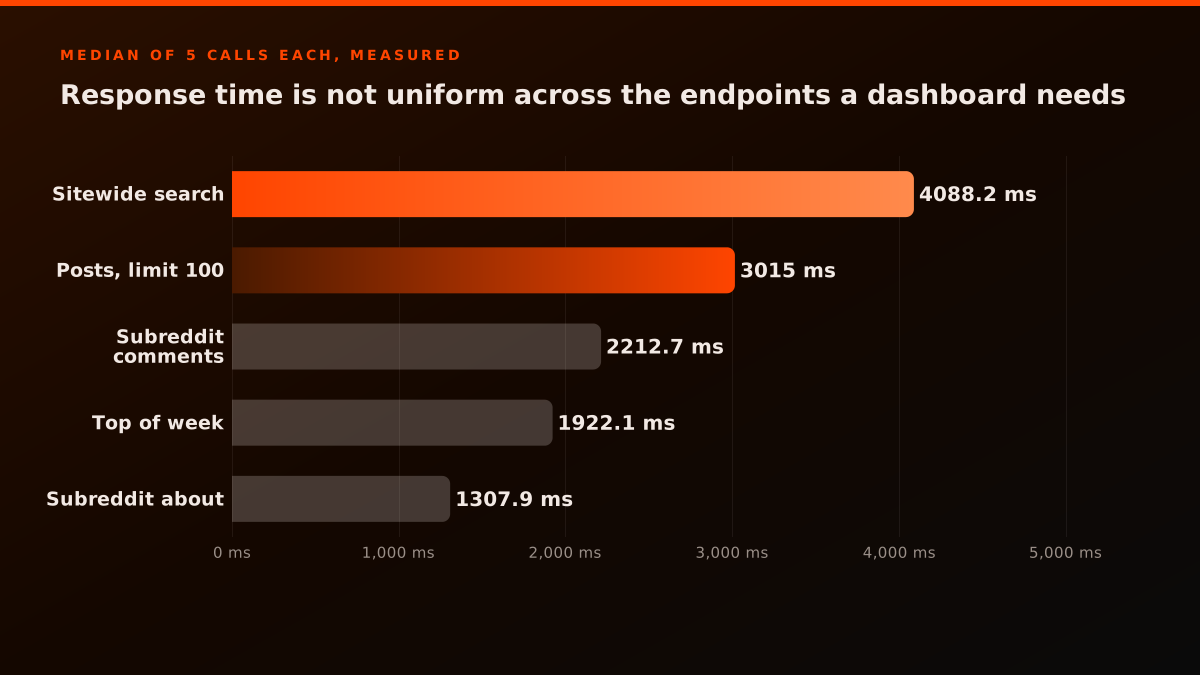
We timed all of them five times each on 2026-08-31:
What the collector pays per endpoint
SLOWEST ENDPOINT
4,088 ms
CHEAPEST PER ITEM
180 B
GZIP SAVING, PEAK
79.6%
Five calls per endpoint on 2026-08-31 from one client, so these are wall-clock times including network transit rather than server processing times. The ordering reproduces; the absolute values will not.
The spread matters for one specific design decision, which is whether a dashboard page can call the API directly. At a median of 3,015 ms for a single 100-post listing, a page rendering five communities on demand would take fifteen seconds before it drew anything. It cannot be a live read. The dashboard queries your database, and a separate job talks to Reddit.
The payload numbers push the same way:
What each endpoint a dashboard needs actually costs
| Endpoint | Median latency | Items returned | Wire bytes | Decoded bytes | Gzip saving | Bytes per item | Source |
|---|---|---|---|---|---|---|---|
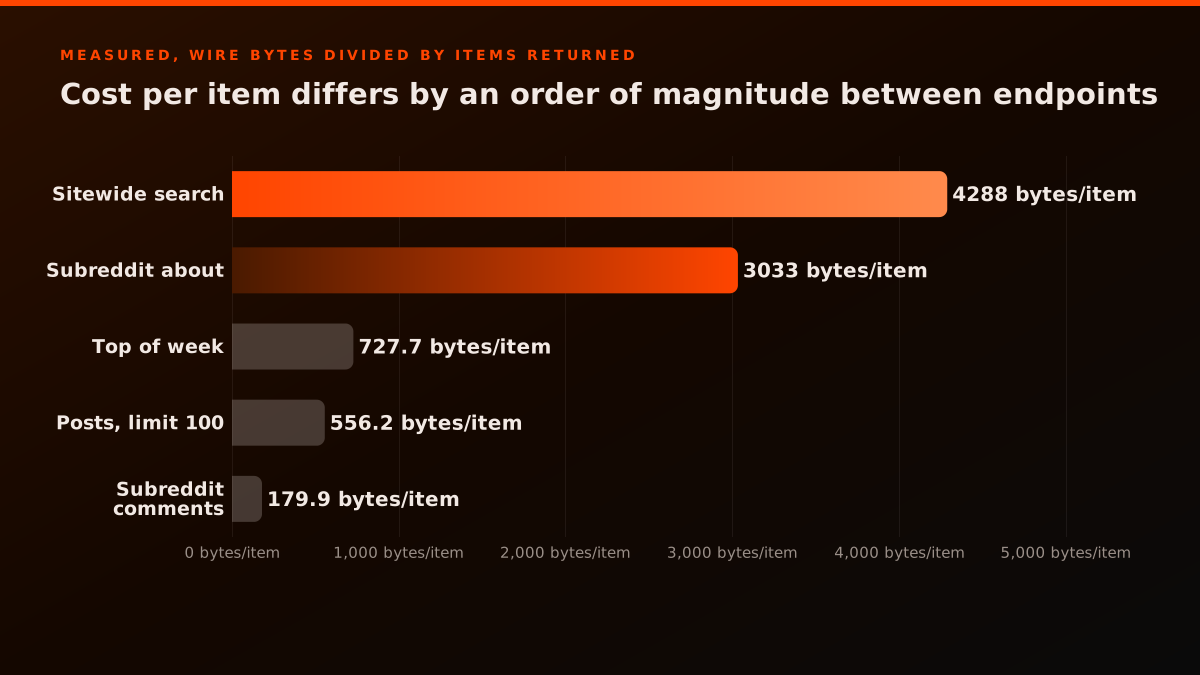
| Subreddit about | 1,307.9 ms | 1 | 3,033 | 6,907 | 56.1% | 3,033.0 | measured |
| Top of week | 1,922.1 ms | 22 | 16,009 | 47,062 | 66.0% | 727.7 | measured |
| Subreddit comments | 2,212.7 ms | 100 | 17,989 | 88,293 | 79.6% | 179.9 | measured |
| Posts, limit 100 | 3,015.0 ms | 100 | 55,622 | 190,355 | 70.8% | 556.2 | measured |
| Sitewide search | 4,088.2 ms | 100 | 428,801 | 1,151,928 | 62.8% | 4,288.0 | measured |
Two rows in that table deserve attention beyond the headline.
Sitewide search costs about 4,288 bytes per item against 556 for a listing, roughly eight times more per result, because search returns fuller objects across many communities. Search is the right tool for keyword monitoring and the wrong one for routine metrics, and the price difference is the reason.
Top of week returned 22 items when we asked for 100. Reddit served fewer than the requested limit, which is normal and is not an error. Any code that treats a short page as the end of the data, or that divides by an assumed 100, will be quietly wrong. Read the length you actually got.
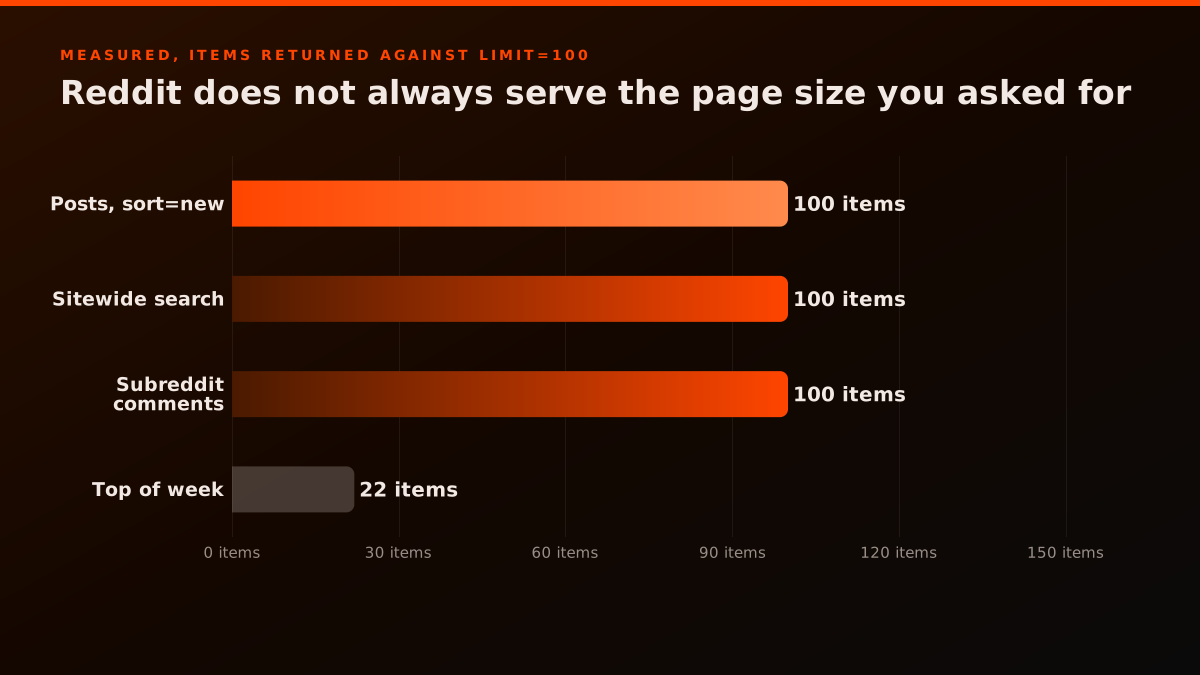
Three of the four endpoints filled the page and one did not, and the one that did not is the one carrying a time filter. That is the pattern to expect: a filtered listing returns what matched, not what you asked for, and the gap between those two is not an error condition you can detect from the status code.
Compression is the cheapest win available:
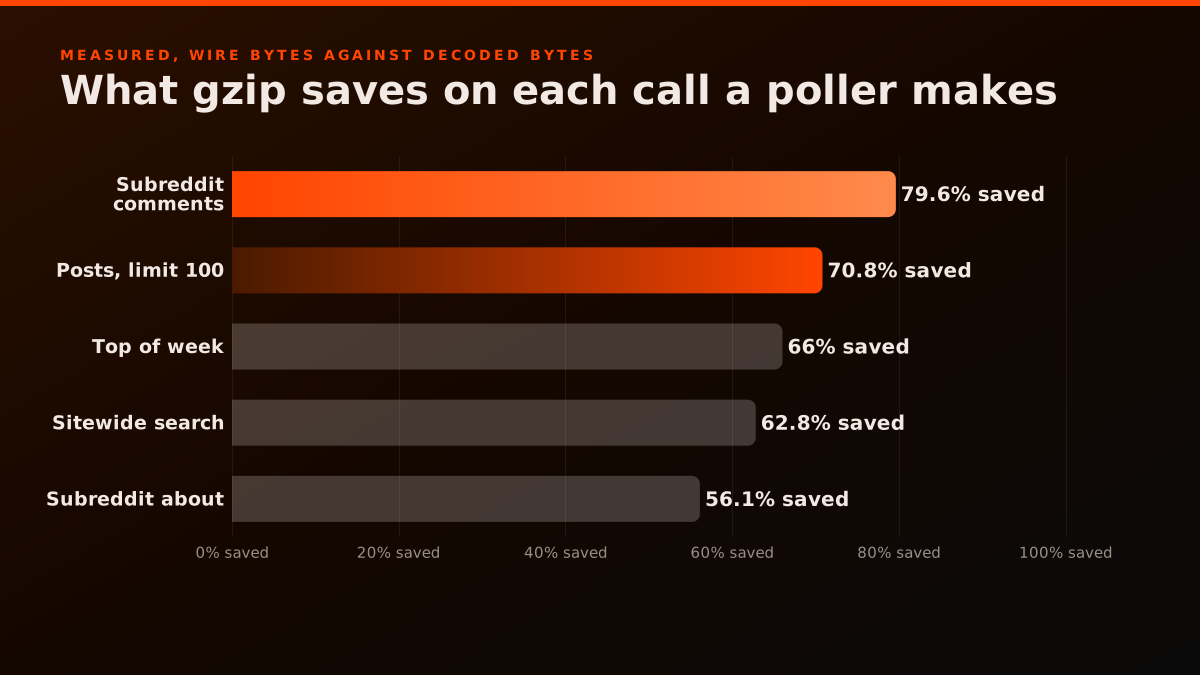
Between 56.1% and 79.6% of every response is compressible, and a poller running every 15 minutes is making thousands of these calls a day. The one trap is that requesting compression without decoding it produces bytes that parse as garbage rather than raising a clean error, so it presents as a broken API rather than a client bug. Set the header and confirm you are decoding, in that order.
How often should you poll a subreddit?
Often enough that a page of 100 posts never fills between polls, and that is a per-community number, not a global one. This is the decision that governs everything else, and getting it wrong loses data permanently rather than degrading gracefully.
A listing call returns at most 100 items. If more than 100 posts appear between two polls, the ones in the middle are gone: they are past the first page and your next poll starts from the top again. Nothing reports this. Your dataset simply has a hole.
The size of that risk varies enormously:
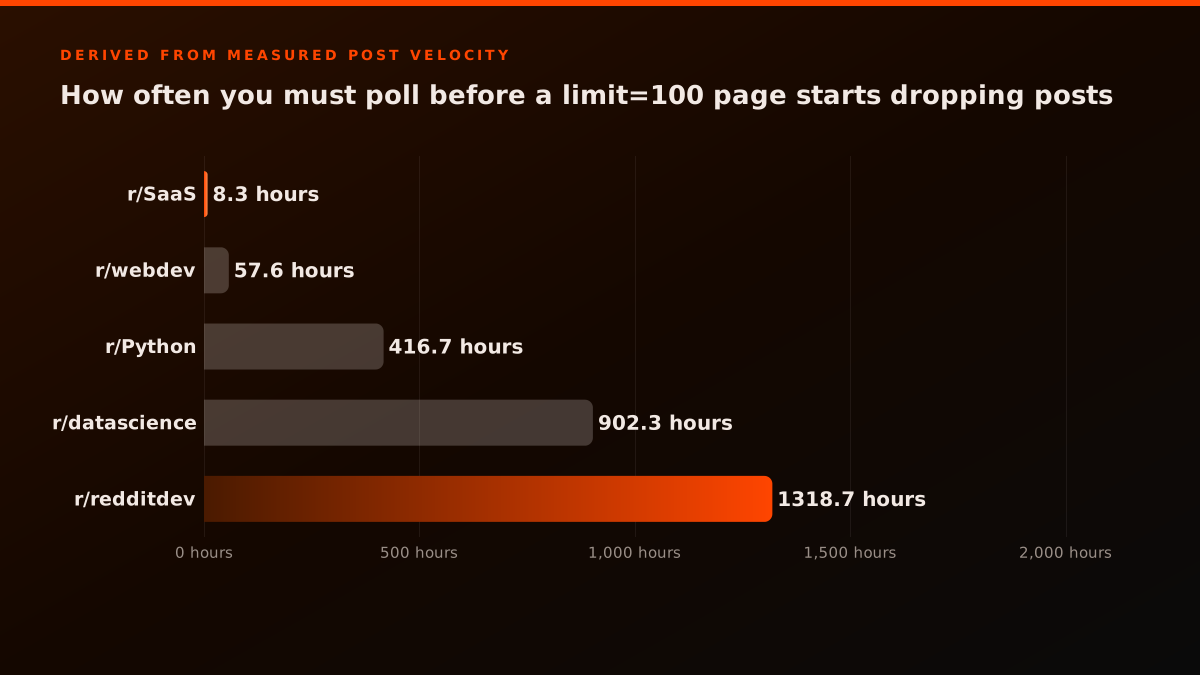
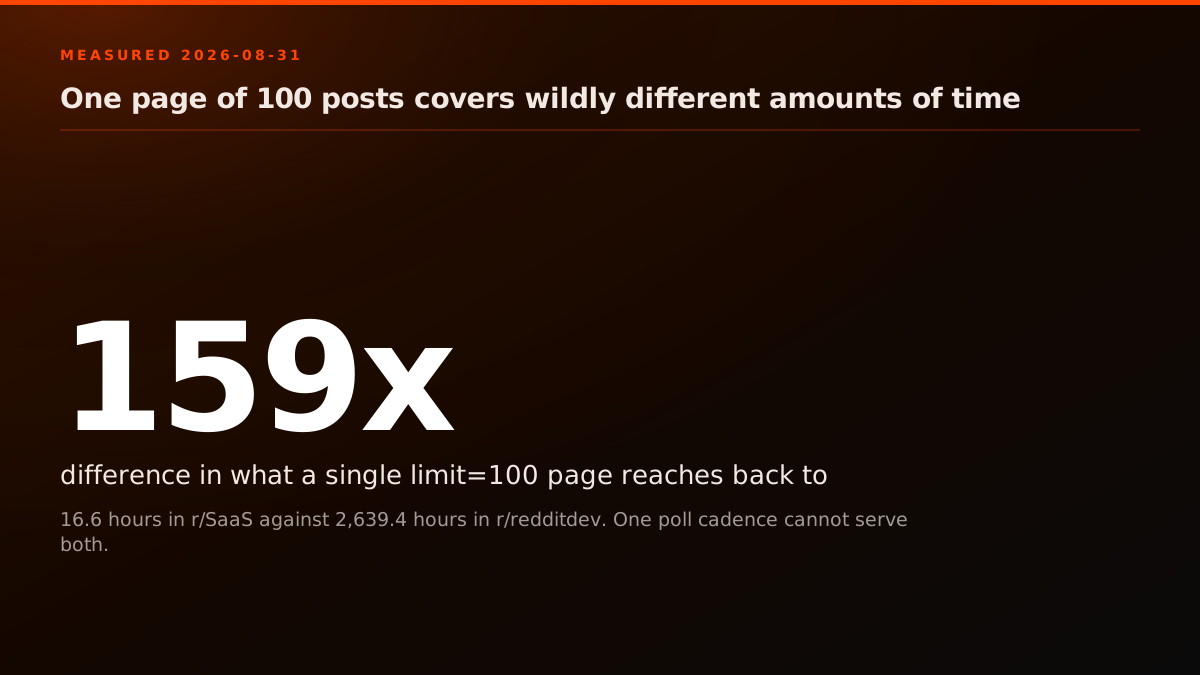
Measured on 2026-08-31, one page covered 16.6 hours in r/SaaS and 2,639.4 hours in r/redditdev. That is a 159x spread from the same API call with the same parameters.
Measured post velocity and the polling interval it implies
| Community | Window one page covered | Posts per day | Hours to fill 100 posts | Safe poll interval | Source |
|---|---|---|---|---|---|
| r/SaaS | 16.6 hours | 144.80 | 16.6 | 8.3 hours | measured |
| r/webdev | 115.2 hours | 20.83 | 115.2 | 57.6 hours | measured |
| r/Python | 833.6 hours | 2.88 | 833.3 | 416.7 hours | measured |
| r/datascience | 1,805.1 hours | 1.33 | 1,804.5 | 902.3 hours | measured |
| r/redditdev | 2,639.4 hours | 0.91 | 2,637.4 | 1,318.7 hours | measured |
The practical answer for most builds is to poll everything on one generous cadence, because the budget makes that easy, and to keep the per-community number for two specific purposes. The first is backfill: after an outage, knowing that r/SaaS fills a page in 16.6 hours tells you immediately whether a four-hour gap lost data (it did not) or a two-day gap did (it did). The second is alerting: a community whose measured velocity suddenly doubles is either having a moment or has been brigaded, and either way your cadence assumption needs revisiting.
The correct way to page, when you do need to go deeper than one page, is to follow the cursor the response hands back rather than constructing one. We have written up how the cursor actually behaves including the part that catches people out, which is that an exhausted cursor does not reliably mean you have every item.
What should you store?
Two tables and, for as long as you can afford it, the raw payload. The schema is small, and three decisions in it are the ones that matter.
create table post (
  id            text        primary key,   -- Reddit's own post id
  subreddit     text        not null,
  author        text        not null,
  created_utc   timestamptz not null,
  title         text        not null,
  score         int         not null,
  num_comments  int         not null,
  is_self       boolean     not null,
  first_seen_at timestamptz not null,
  last_seen_at  timestamptz not null
);

create index on post (subreddit, created_utc desc);

create table subreddit_snapshot (
  subreddit         text        not null,
  observed_at       timestamptz not null,
  subscribers       bigint,                -- nullable on purpose
  active_user_count bigint,                -- nullable, currently always null
  http_status       int         not null,
  primary key (subreddit, observed_at)
);
The post table is keyed by Reddit's post id and upserted, never appended. A poll returns posts you already have, and appending gives you duplicates that silently inflate every count. Upserting on the id updates the mutable counters, score and num_comments, while leaving created_utc alone.
first_seen_at and last_seen_at are separate columns. This is the pair that makes engagement decay possible later without re-architecting: last_seen_at tells you when the stored score was true, which is the difference between a number and a measurement.
subscribers and active_user_count are nullable, and http_status is stored beside them. A field that stops populating is not hypothetical here: active_user_count returned null in 20 of 20 communities we queried on 2026-08-31, every one answering HTTP 200. A not null default 0 column would have written zeros for all of them and produced a chart showing engagement collapsing to nothing. Storing the status alongside is what lets you tell a successful read of an empty field from a failed call. We covered what that null actually means for audience work in the companion post.
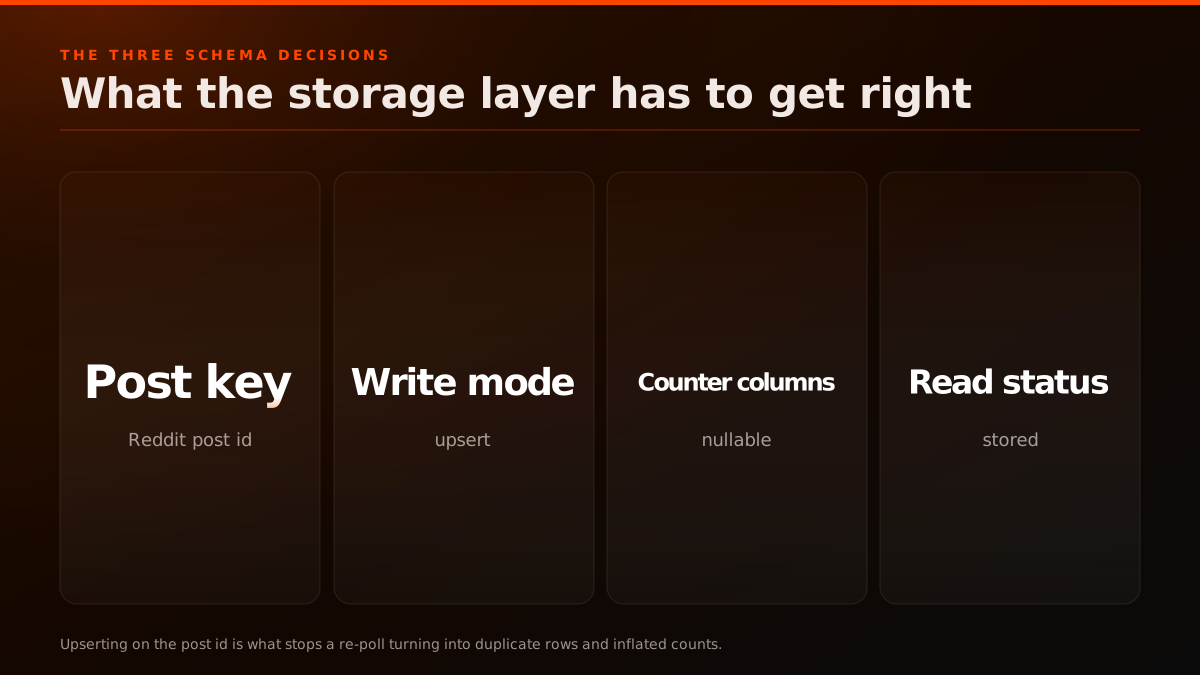
Those four choices are the whole storage design, and each one exists to prevent a specific wrong number rather than to be tidy.
Storing raw payloads is the decision people skip and regret. Every derived figure in this post was recomputed from stored responses, which is how the AutoModerator finding was possible without re-fetching anything. A pipeline that stores only computed metrics cannot answer a question you had not thought of when you wrote it.
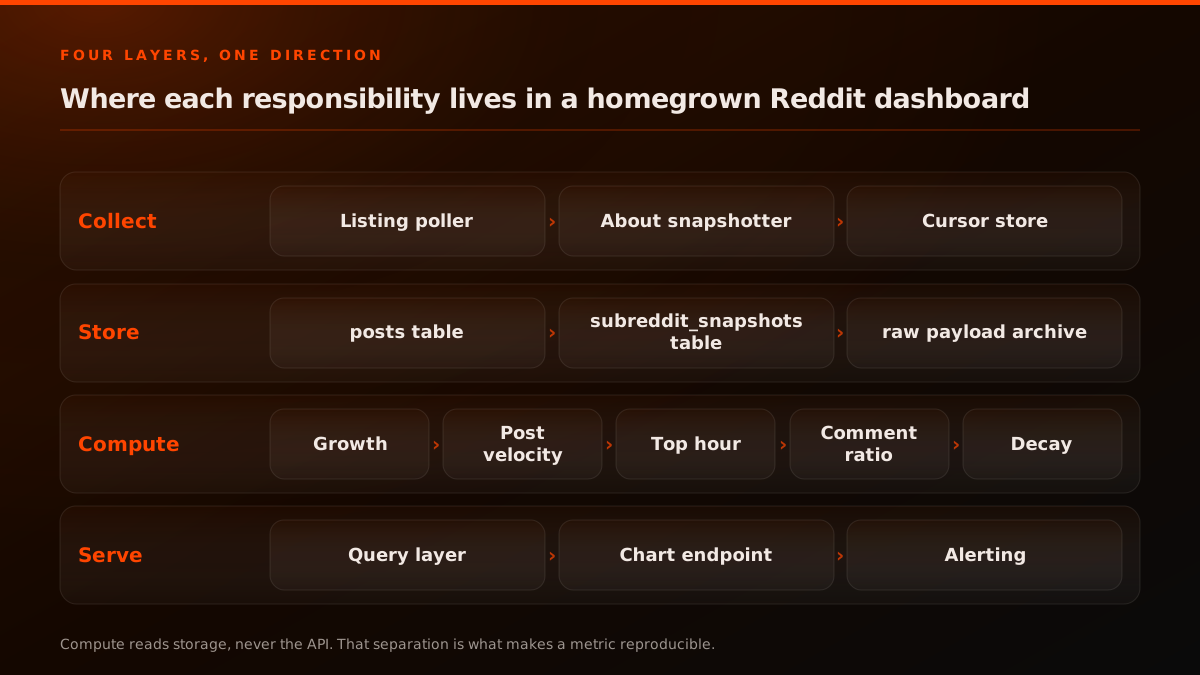
Drawn as a dependency graph rather than as layers, the same rule shows up as which boxes have an arrow into them:
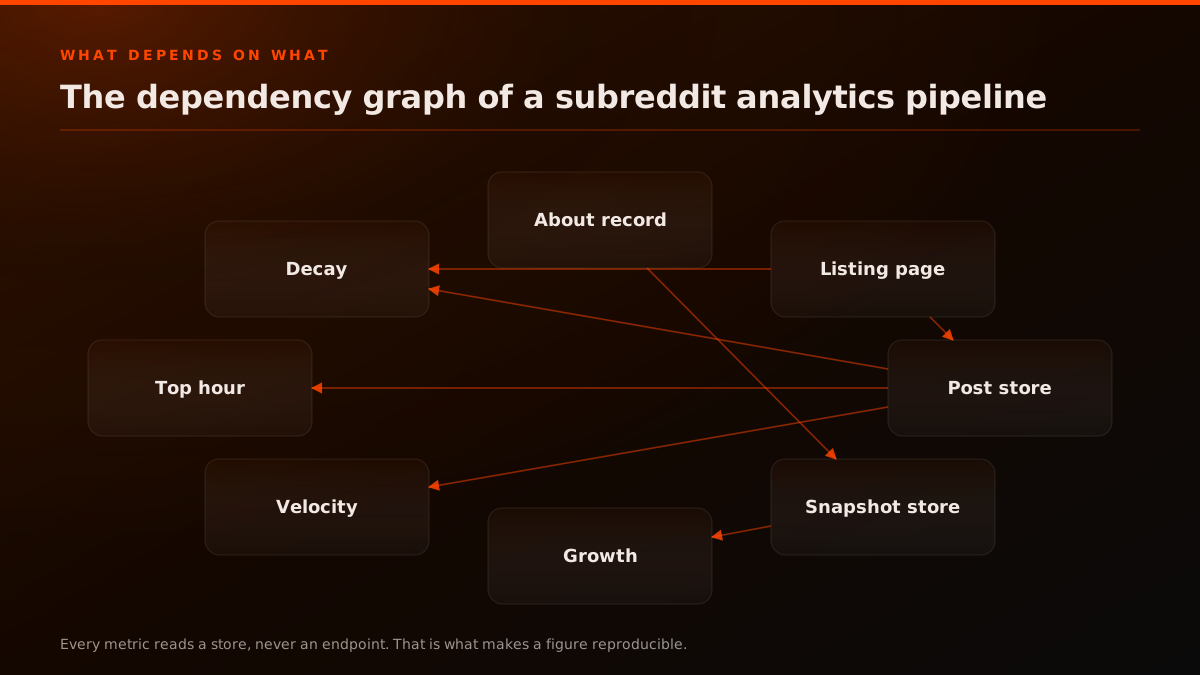
Every metric node's inbound arrow comes from a store, never from an endpoint. Decay is the one metric that also has a second inbound edge from the listing page, because it is the only one that needs to go back and re-read, and that extra edge is exactly why it is the metric that costs more than the others.
The direction in that diagram is the whole architecture. Compute reads storage. Compute never reads the API. That separation is what makes a metric reproducible: if a number looks wrong, you can recompute it from the same rows and get the same answer, which is impossible if the metric is computed from a live call that will never return quite the same thing twice.
The polling loop
Six steps, repeated forever, and the third one is where most implementations go wrong.
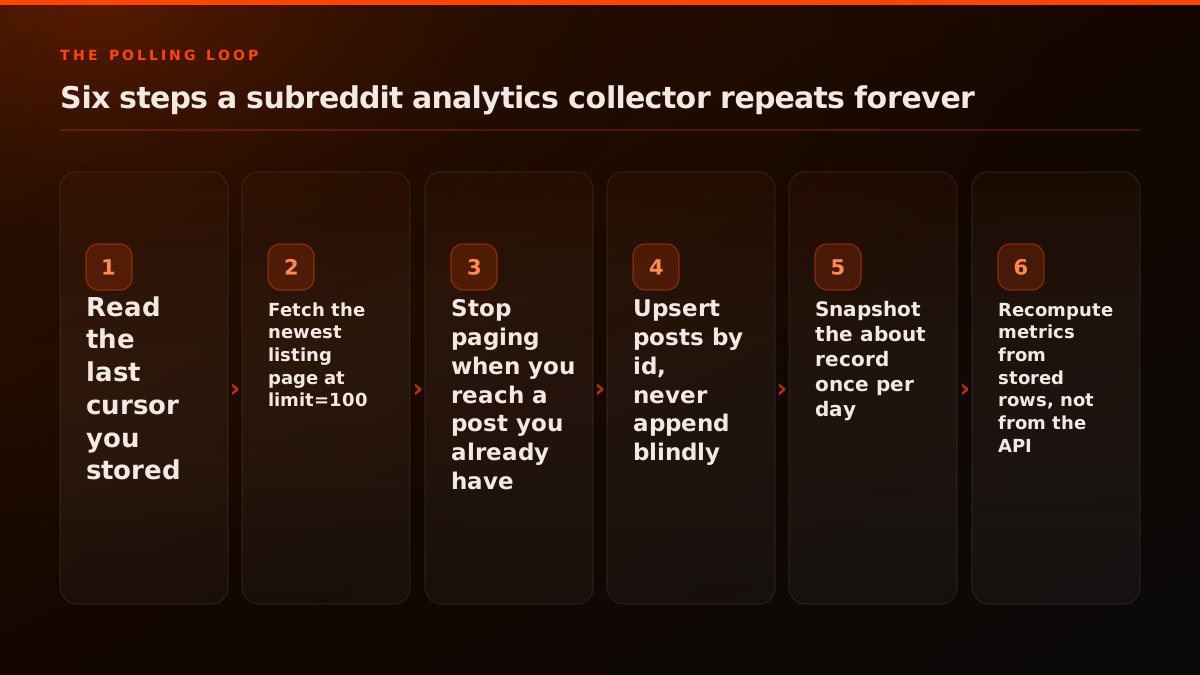
In code, with the parts that matter left in:
import os, requests, psycopg2
from datetime import datetime, timezone

KEY  = os.environ["REDDIT_APIS_KEY"]
BASE = "https://api.redditapis.com"
SESSION = requests.Session()
SESSION.headers.update({
    "Authorization": f"Bearer {KEY}",
    "Accept-Encoding": "gzip",
})

def poll(subreddit, conn, max_pages=5):
    seen_ids = existing_ids(conn, subreddit)
    after, fetched, new = None, 0, 0

    for _ in range(max_pages):
        params = {"subreddit": subreddit, "sort": "new", "limit": 100}
        if after:
            params["after"] = after
        r = SESSION.get(f"{BASE}/api/reddit/posts", params=params, timeout=60)
        r.raise_for_status()
        payload = r.json()
        posts = payload["posts"]
        if not posts:
            break

        fetched += len(posts)
        now = datetime.now(timezone.utc)
        for p in posts:
            upsert_post(conn, p, now)
            if p["id"] not in seen_ids:
                new += 1

        # Stop as soon as the page is entirely posts we already had.
        if all(p["id"] in seen_ids for p in posts):
            break

        after = payload.get("after")
        if not after:
            break

    conn.commit()
    return {"fetched": fetched, "new": new}
Three details are load-bearing.
max_pages exists so a bug cannot page forever. Without it, a subreddit that returns a cursor indefinitely will drain your budget in one run, and the failure looks like an outage rather than a loop.
The stop condition tests whether the whole page is already known, not whether any single post is. Reddit's new sort is close to chronological but a post can be edited, removed or restored, so a page can contain one familiar post among fresh ones. Stopping on the first known id truncates the run.
And the return value reports fetched and new separately. A run that fetched 300 and stored 0 new posts is healthy. A run that fetched 500 and stored 500 new means you were paging further back than usual, which usually means the previous run failed and nothing told you.
Computing the five metrics
All five come out of the stored rows. Here is each one, with the mistake that makes it wrong.
Post velocity is the post count over the window the timestamps span, not per calendar day:
select subreddit,
       count(*) as posts,
       extract(epoch from (max(created_utc) - min(created_utc))) / 86400.0 as days,
       count(*) / nullif(extract(epoch from (max(created_utc) - min(created_utc))) / 86400.0, 0)
         as posts_per_day
from post
where created_utc > now() - interval '7 days'
group by subreddit;
The nullif guard matters more than it looks: a community with one post in the window has a zero-length span, and dividing by it either crashes the job or produces an infinity that poisons every downstream chart.
Top hour of day, with the correction that makes it real:
select extract(hour from created_utc at time zone 'UTC') as utc_hour,
       count(*) as posts
from post
where subreddit = 'Python'
  and author <> 'AutoModerator'
  and created_utc > now() - interval '30 days'
group by 1 order by 2 desc limit 3;
That one author <> 'AutoModerator' clause is the difference between a right answer and a wrong one. AutoModerator wrote 31 of the 100 newest posts in r/Python when we measured, all at 00
Comment-to-upvote ratio is the sum over the sum, not the average of the ratios:
select subreddit,
       sum(num_comments)::numeric / nullif(sum(score), 0) as comments_per_upvote
from post
where created_utc > now() - interval '7 days'
group by subreddit;
Averaging per-post ratios weights a post with 1 upvote and 3 comments equally with one carrying 4,000 upvotes, and since low-score posts are the majority the average tells you about the tail rather than the community.
Subreddit growth is a difference between snapshots, and the guard is the null:
select subreddit, observed_at::date as day,
       max(subscribers) - lag(max(subscribers)) over (
         partition by subreddit order by observed_at::date
       ) as daily_growth
from subreddit_snapshot
where http_status = 200 and subscribers is not null
group by subreddit, observed_at::date;
Both conditions in that where clause earn their place. Filtering on http_status = 200 excludes failed reads. Filtering subscribers is not null excludes successful reads of an empty field, which is a genuinely different situation and one that is live right now for the active-user column.
Engagement decay is the only metric that needs re-reading rather than a single pass. Batch the ids you want to re-check and read them again at fixed offsets after creation:
def decay_pass(conn, offsets_hours=(1, 6, 24)):
    for offset in offsets_hours:
        ids = posts_due_for_recheck(conn, offset)
        for batch in chunks(ids, 100):
            r = SESSION.get(f"{BASE}/api/reddit/by_id/{','.join(batch)}", timeout=60)
            r.raise_for_status()
            for p in r.json().get("posts", []):
                record_decay_point(conn, p, offset)
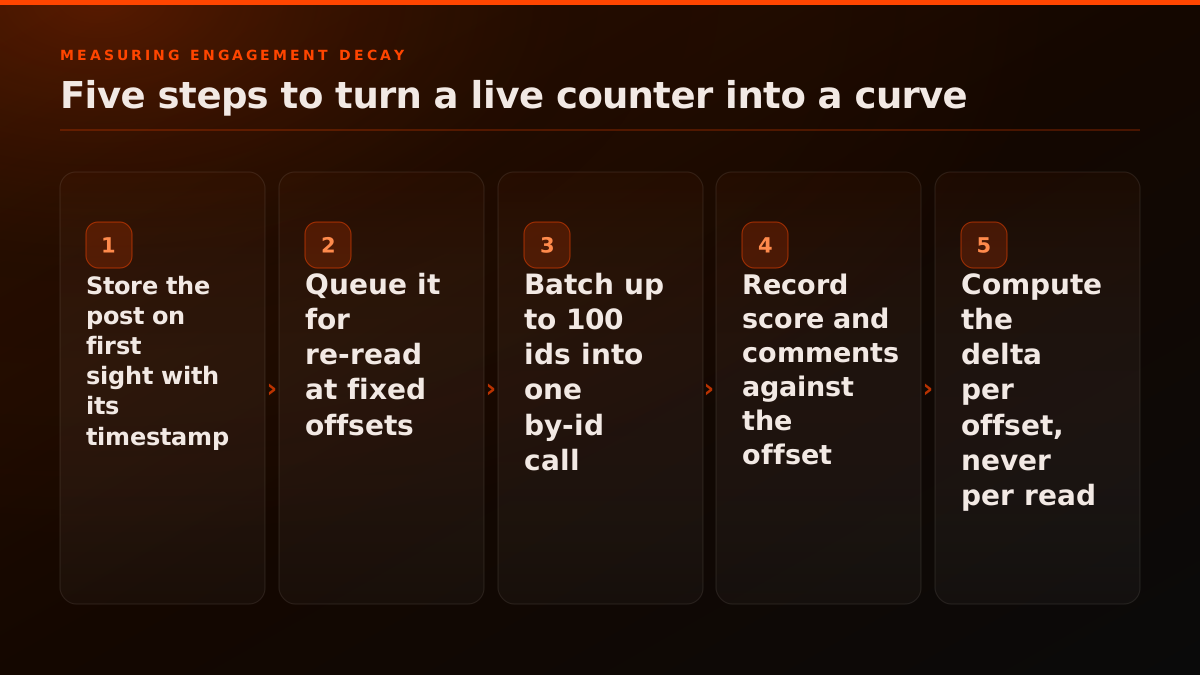
Reading by id in batches is what keeps this affordable, because one call covers up to 100 posts. The choice of offsets is arbitrary and it changes the curve you get, so pick them once, write them down, and do not quietly change them later, which would make old and new rows incomparable. Fetching in bulk by id covers the endpoint in more detail.
A sixth metric worth adding once the five work
Contribution concentration is the cheapest metric nobody computes, and it comes free from rows you already have: count distinct authors per hundred posts.
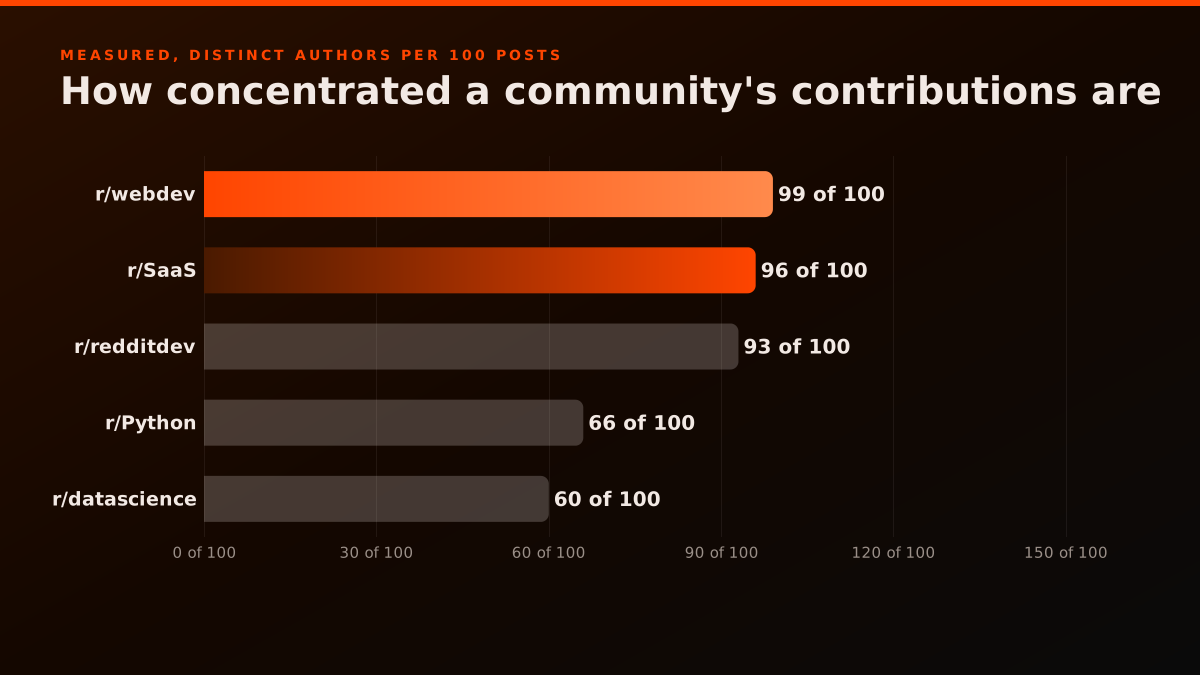
Measured across the same 500 posts, r/webdev returned 99 distinct authors per 100 posts and r/datascience returned 60. A community near 100 is a broad conversation where almost nobody posts twice in the window. A community in the sixties is one where a smaller group is doing the posting, either because it is quieter and the same people return, or because a handful of accounts are prolific.
select subreddit,
       count(*)                as posts,
       count(distinct author)  as authors,
       round(100.0 * count(distinct author) / count(*), 1) as authors_per_100
from post
where created_utc > now() - interval '7 days'
  and author <> 'AutoModerator'
group by subreddit;
Excluding automation matters here for the same reason it did for the hour histogram, and it bites harder: AutoModerator is one author writing many posts, so leaving it in pushes the ratio down and makes a community look more concentrated than it is. In r/Python it accounted for 31 of 100 posts from a single account, which alone moves the distinct-author count by nearly a third.
The reason to compute this is that it changes what an outreach or research strategy should be. A community at 99 authors per 100 posts has no gatekeepers to build a relationship with. One at 60 does. Neither number is visible from the subscriber count, which is the whole argument for a dashboard.
Start building with Redditapis
Reads $0.0015, votes $0.005, writes $0.012, DMs $0.025. $0.50 free credits.
What does it cost to run?
Very little, and almost certainly less than you expect.
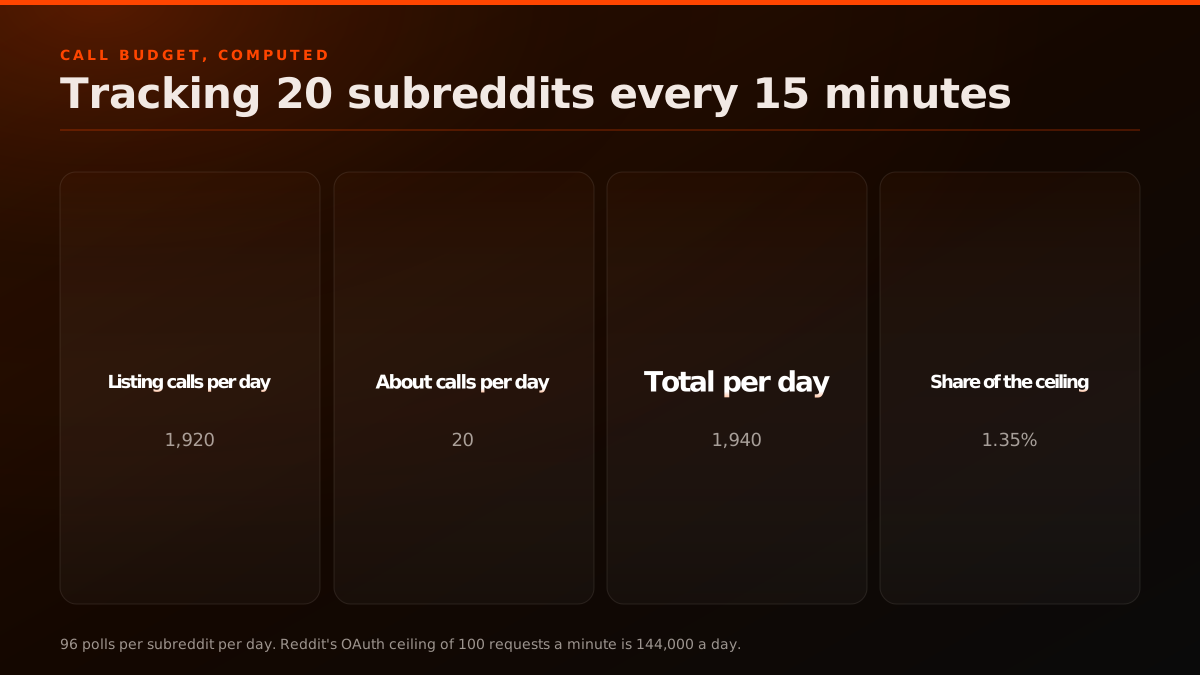
Tracking 20 communities at a 15 minute cadence is 96 polls per community per day, 1,920 listing calls, plus one about snapshot each for 20 more. That is 1,940 calls a day against a documented budget of 100 requests a minute, which is 144,000 a day. The dashboard uses 1.35% of it.
Daily call cost of a listing poller, computed
| Communities tracked | Poll cadence | Polls per community per day | Listing calls | About calls | Total per day | Share of a 144,000 ceiling | Source |
|---|---|---|---|---|---|---|---|
| 5 | 15 minutes | 96 | 480 | 5 | 485 | 0.34% | derived |
| 20 | 15 minutes | 96 | 1,920 | 20 | 1,940 | 1.35% | derived |
| 50 | 15 minutes | 96 | 4,800 | 50 | 4,850 | 3.37% | derived |
| 20 | 5 minutes | 288 | 5,760 | 20 | 5,780 | 4.01% | derived |
| 20 | 60 minutes | 24 | 480 | 20 | 500 | 0.35% | derived |
What the call count does not tell you is what access costs, and that is a separate and more contested question that comes up in r/redditdev regularly:
View on RedditThe distinction worth holding onto is that call volume and commercial terms are two different constraints. A dashboard like this is trivially small in call volume, as the table shows. Whether you are permitted to make those calls at all, and under what agreement, is governed by Reddit's access policy rather than by any rate limit, and that has been the moving part since 2025.
There is a related question about how the budget is scoped, which matters if you are running several jobs:
View on RedditThe answer shapes your architecture. A budget scoped to the OAuth client means splitting a workload across machines buys you nothing, and the fix for a genuinely large workload is a second credential rather than a second server.
The table's own caveat is the important part: that model excludes retries, backfill and any per-author work, and any of the three can dominate. A retry loop hammering a failing endpoint will exceed the entire daily budget by itself, which is why the real constraint on a build like this is error handling rather than cadence. Cap retries, back off exponentially, and count your calls in the same place you count your posts.
The one workload that genuinely costs is per-user analysis. Resolving the authors of a single 100-post page runs to about 97 additional calls, so author-level work belongs in a nightly job rather than anywhere near a page refresh. The audience-proxy companion works through what that buys you.
One community, five metrics, computed from stored rows
POSTS PER DAY
144.80
COMMENTS PER UPVOTE
1.057
DISTINCT AUTHORS PER 100
96
Figures are the r/SaaS row of the measured velocity and engagement tables on this page, read 2026-08-31. The two red rows are hard limits of the data source rather than gaps in the implementation.
Where a homegrown dashboard wins, and where it loses
It wins on durability, on retention, and on metrics nobody sells. It loses on time to first chart, on alerting, and on everything a UI gives you for free.
The durability argument stopped being theoretical in November 2025, when a widely used hosted Reddit research tool shut down after failing to reach a commercial API agreement with Reddit. Practitioners described the effect directly. One put it as:
View on Reddit"Gummy Search shutting down kinda messed with my routine... So I built my own version"
Another, writing up the tool landscape afterwards, noted that the free fallback most people reached for offered "no AI, no filtering, no scoring, no reply suggestions, no dashboard, no analytics." When a hosted tool goes away, its users lose the tooling and the history in the same week. A pipeline you own keeps its rows.
Reddit's own access posture is the other half of this. Self-service access to the public data API closed in November 2025 under what Reddit called the Responsible Builder Policy, with approval now required, and Reddit staff have since said they will "gradually start restricting all new requests" and require third-party apps to port to the Developer Platform. One developer described the practical effect of that gate on a small personal project:
"I've been trying to get Reddit API credentials for a few weeks now and still no response... Since the official route seems basically dead for personal projects right now, I started looking into alternatives."
That is a real cost of the build-it-yourself path and this guide would be dishonest not to name it: building on raw personal-account OAuth now means clearing an approval process with an uncertain timeline. Building on a hosted API layer routes around that specific friction, which is a genuine argument for one and against the other depending on what you are doing.
The retention argument is worth separating from the durability one, because they are different and only the first is usually stated. Durability is about the tool disappearing. Retention is about what a surviving tool chooses to keep: hosted analytics products aggregate aggressively, because storing every raw item for every customer is their largest cost, so the older your question the coarser the answer available. A pipeline you own makes that tradeoff yours. You can keep daily granularity for a year on a few gigabytes, which is a decision no vendor will make on your behalf because it does not pay them to.
The third argument is the one that actually justifies the work for most teams, and it is neither of those. It is that you can compute a metric nobody sells. Contribution concentration is a good example: it took one SQL statement over rows already stored, it is not offered by any hosted Reddit tool we are aware of, and it changes how you would approach a community. Every organisation has two or three questions shaped like that, specific to how they actually operate, and they are precisely the questions a general-purpose product will never answer because the market for each one is a single customer.
Where a homegrown build loses is less dramatic and more certain. You will not have alerting on day one. You will not have a UI. And you will have no history before the day you start collecting, because no endpoint returns last year's post volume. That last one is the strongest reason to start collecting before you are sure you need it: storage is cheap and the past is not purchasable.
What the access rules actually permit
Before you schedule anything, it is worth being clear about what you are allowed to run, because this is the part of the build that changed most recently and the part most older guides get wrong.
Collection of public Reddit data through the official API is governed by the Reddit Data API Terms, and the request budget is described in Reddit's own Data API Wiki. The substantive change is that self-service access closed in November 2025 under the Responsible Builder Policy, which Reddit announced in its own words:
"Starting today, self-service access to Reddit's public data API will be closed. Anyone looking to build with Reddit data, whether you're a developer, researcher, or moderator, will need to request approval before gaining access."
That trajectory has continued. In a later statement on the future of public data, Reddit said it would "gradually start restricting all new requests" and require third-party apps to port onto its Developer Platform.
Three practical consequences follow for a dashboard build. Getting your own credential is now an approval process rather than a form, so factor in a timeline you do not control; the current walkthrough for obtaining access covers what that involves. Unauthenticated collection is not a fallback, because the public JSON endpoints no longer serve automated clients. And the legal position on what you may do with collected public data is separate from the technical question of whether you can fetch it, which we cover in the legal overview.
None of this makes the build harder once you have access. It makes the access step the long pole, which is worth knowing before you plan around it.
Scheduling the collector
The collector is a cron-shaped job, and the two decisions that matter are where the schedule lives and what happens when a run overlaps the previous one.
Put the cadence in configuration rather than in code, per community, because the measured page spans differ by 159x and you will want to tune individual communities without a deploy:
communities:
  - name: SaaS
    cadence_minutes: 15      # page span measured at 16.6h, ample headroom
  - name: webdev
    cadence_minutes: 60      # page span 115.2h
  - name: redditdev
    cadence_minutes: 360     # page span 2,639.4h, effectively unlimited
defaults:
  cadence_minutes: 60
  max_pages: 5
  retry_max: 3
Overlap protection matters more than it sounds. If a run takes longer than the cadence, a naive scheduler starts a second one, both page the same listing, both write the same rows, and your call count doubles while your data does not improve. An advisory lock keyed on the community is the smallest fix:
select pg_try_advisory_lock(hashtext('poll:' || $1));
If it returns false, skip this cycle and log it rather than queueing, because a queued backlog of polls against a listing that has barely moved is pure waste.
For the language-specific mechanics, the same loop is straightforward in either ecosystem, and we have walkthroughs for Python, Node and TypeScript if you would rather start from working code than from the pseudocode above. Authentication is the one part worth getting right first, and the OAuth walkthrough covers token handling and refresh.
Extending past posts
Once the post pipeline works, two extensions cost very little and add disproportionate value.
Comments are the obvious one, and they are cheaper per item than posts: the subreddit comments endpoint returned 100 items at 179.9 bytes each on the wire against 556.2 for posts, because comment objects are smaller. Adding a comments table keyed the same way gives you conversation depth per post and reply latency, both of which are invisible from post-level data. Comment search covers the query side when you need to find specific discussion rather than sample all of it.
Keyword coverage is the other, and it is where sitewide search earns its cost despite being the most expensive endpoint per item. Your listing poller only sees the communities you chose; a scheduled search catches mentions in communities you did not think to track. Run it far less often than the listing poller, and be deliberate about the query, because search operators behave differently than most people assume and a query that looks precise may be matching far more loosely than intended.
The natural third step is trend detection over the rows you are already storing, which needs no new endpoint at all: detecting trending topics is a query pattern over the same post table. And if you are choosing which communities to track in the first place, finding subreddits programmatically is the discovery step that feeds the config above.
Is a self-built number trustworthy?
It can be trustworthy enough to disagree with Reddit's own moderator tooling and hold up, provided you document the method.
The best public example is an analyst who polled one subreddit's listing once a day for three months, accumulating 8,885 posts, and published the resulting charts. A moderator of that community responded that the numbers conflicted with the internal mod dashboard and posted a screenshot. The analyst's reply is a model of how to handle this:
"By hand, I've verified that the last 500 posts that are on rCon are also in my dataset in the correct order without a single omission, and I only over count by less than 1%."
Two measurement methods disagreeing does not mean one is broken. It usually means they count different things: a mod dashboard may exclude removed posts, count a different window, or dedupe differently. What made that analyst's position defensible was not that they were confident, it was that they had a stated method, a hand-verified sample and a quantified error bound. Those three things are what turn a self-built number into evidence, and they cost about an hour.
The same standard applies to your own dashboard. Store the raw payload so a disputed figure can be recomputed. Record the window every metric was computed over. And when a number surprises you, check the instrument before you believe the finding, because in our own pass the most surprising result of the day, a community with a hard midnight activity spike, turned out to be a scheduled bot.
A short walkthrough of pulling subreddit information through an API covers the mechanics if you prefer watching to reading:
And practitioners have been building in this space continuously since the hosted options thinned out:

Arthur
@arthuryuzbashev
Updated RedditFast based on customer feedback ⚡️ - Upgraded subreddit analytics - Added project deletion feature - Improved UI and text Will continue working on it today 🔥 https://t.co/lVAXAg9sz0

The pattern generalises past dashboards. Once the polling loop and the store exist, the same rows support monitoring, alerting and agent-driven workflows, because all three are queries over stored posts rather than new integrations:

Jáen
@speedrunjaen
How to Build an AI Agent for Reddit Social Listening Reddit is one of the best places to find people who have the exact problem your product solves. They're posting about it in public, describing their pain in detail, asking for recommendations. Most founders never see it https… Show more

That is the real return on building the pipeline rather than buying a chart. The dashboard is the first thing you get out of it, not the last.
Handling deleted, removed and edited posts
A listing is a live view, not an append-only log, and three kinds of change will happen underneath your poller. Designing for them is the difference between a dataset that survives a year and one that quietly rots.
Deleted by the author. The post object persists but the author becomes [deleted] and the body empties. Your stored row still has the original author name if you captured it before deletion, which is a genuine privacy consideration as well as a data one. The practical rule is to keep the row, mark it, and decide deliberately whether your retention policy keeps the original author string.
Removed by a moderator. The post disappears from the listing entirely. It does not appear in your next poll and nothing signals that it was ever there. This is why a naive count of "posts this week" computed by re-polling will drift downward over time while your stored count stays flat, and the two will disagree. Neither is wrong; they measure "what is visible now" and "what we saw" respectively. Decide which one your dashboard claims to show and label it.
Edited. Titles rarely change; scores and comment counts change constantly, because they are live counters rather than facts. This is why the schema separates first_seen_at from last_seen_at. A score without a read timestamp is not a measurement.
alter table post add column removed_detected_at timestamptz;

-- Mark rows that stopped appearing in a listing we still poll.
update post p
   set removed_detected_at = now()
 where p.subreddit = $1
   and p.removed_detected_at is null
   and p.created_utc > now() - interval '48 hours'
   and not exists (select 1 from poll_seen s
                    where s.post_id = p.id and s.poll_at > now() - interval '1 hour');
The 48-hour bound in that statement matters. Without it you would mark every historical post as removed the moment it aged out of the first page, which is the most common way this check produces nonsense. You can only infer removal inside the window your polling actually covers, and the measured page-span figures are what tell you how wide that window is per community.
The cheapest Reddit API. Try it free.
Reads from $0.0015 per call. $0.50 free credits. No credit card required.
Backfilling after an outage
Your poller will stop at some point, and what you do in the first hour after it restarts determines whether you lose data permanently.
The question to answer first is whether the gap exceeds the community's page span. If r/SaaS fills a 100-post page in 16.6 hours and your poller was down for four, nothing is lost: the posts you missed are still on the first page and a normal poll picks them up. If it was down for two days, the middle of that gap is past page one and only deeper paging can reach it.
def backfill(subreddit, gap_hours, conn, page_span_hours):
    if gap_hours < page_span_hours * 0.5:
        return poll(subreddit, conn)          # normal poll suffices
    pages = int(gap_hours / page_span_hours * 1.5) + 1
    return poll(subreddit, conn, max_pages=min(pages, 10))
The 1.5 multiplier is deliberate slack and the cap at 10 pages is a deliberate refusal to page forever. Both are judgement calls rather than derived constants, and writing them as named numbers rather than burying them is what lets the next person change them knowingly.
The part people skip is recording that a gap happened. A dashboard showing post velocity across an outage will show a dip that looks like the community going quiet, and there is no way to tell that apart from a collection failure unless you stored the failure:
create table poll_run (
  subreddit   text        not null,
  started_at  timestamptz not null,
  ok          boolean     not null,
  fetched     int         not null,
  new_rows    int         not null,
  error       text,
  primary key (subreddit, started_at)
);
Any chart that reports a metric over a period should join against that table and visibly break the line where collection failed, rather than interpolating across it. An interpolated gap is a fabricated number, and it is fabricated in exactly the place a reader is most likely to draw a conclusion.
Serving the dashboard
The serving layer is where the separation between collection and computation pays off, and the rule is that a page load runs one query against your own database rather than any call to Reddit.
At the measured latencies, this is not a preference. A single 100-post listing took a median of 3,015 ms and sitewide search took 4,088 ms, so a page rendering five communities live would spend somewhere between fifteen and twenty seconds fetching before it drew a pixel. Precomputing into a daily rollup makes the same page a single indexed read:
create materialized view subreddit_daily as
select subreddit,
       date_trunc('day', created_utc) as day,
       count(*)                                   as posts,
       count(distinct author)                     as authors,
       sum(score)                                 as score_total,
       sum(num_comments)                          as comment_total,
       percentile_cont(0.5) within group (order by score) as median_score
from post
where author <> 'AutoModerator'
group by subreddit, date_trunc('day', created_utc);

create unique index on subreddit_daily (subreddit, day);
Two choices in that view are worth naming. The automation filter lives in the view rather than in each query, so no dashboard panel can accidentally forget it, which is the same reasoning as putting a security rule in one place. And it stores sums rather than ratios, because a ratio of sums cannot be reconstructed from a stored ratio: keeping the numerator and denominator separately means any ratio you want later is still computable, while storing comments_per_upvote directly throws away the information needed to re-aggregate across days.
Refresh it on the same schedule as your poller, and refresh concurrently so a dashboard read never blocks. The Reddit Data API documentation is the reference for what each field means before you aggregate it, and PRAW's documentation is a useful cross-check on field semantics even if you never use the client, because it names the same attributes.
Alerting on the metrics you now have
Once the numbers exist, the useful ones to alert on are the derivatives rather than the levels, because a level tells you what a community is and a change tells you something happened.
Three alerts cover most of the value. Velocity change: a community whose posts per day doubles against its trailing average is either having a moment worth knowing about or is being brigaded, and both are worth a notification. Author concentration collapse: distinct authors per hundred posts falling sharply means a small group has started dominating, which is the shape of both a spam wave and a genuine controversy. Collection health: a poll run that fetched posts but stored zero new ones for several consecutive cycles is either a genuinely dead community or a broken cursor, and the second is far more likely.
select subreddit, day, posts,
       avg(posts) over (partition by subreddit
                        order by day rows between 7 preceding and 1 preceding) as trailing_avg
from subreddit_daily
where day > now() - interval '30 days';
Alert when posts exceeds twice trailing_avg and the trailing window is complete, and note that last condition carefully: a partial window at the start of collection produces a small average and therefore a flood of false alarms in your first week. Requiring a full seven days before the rule arms is the difference between an alert people trust and one they mute.
If you would rather not build the alerting half at all, keyword-level monitoring with webhook delivery is a genuinely separable problem and we have written up the delivery contract in detail, including what happens to an alert when your endpoint returns a 500.
Failure modes worth designing against
These are the ones that produce a dashboard that looks healthy and is wrong, which is worse than one that is visibly broken.
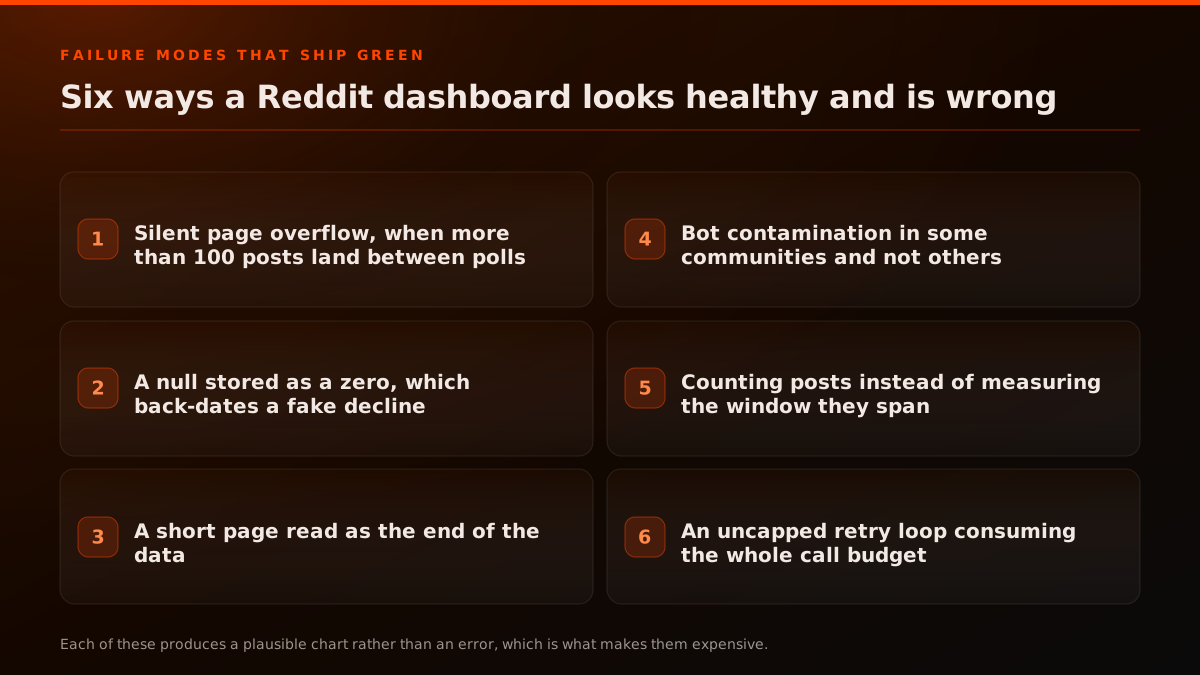
Silent page overflow. More than 100 posts appear between polls, the middle ones are lost, and nothing reports it. Detection is cheap: if a poll stores close to 100 new posts, you were probably at the edge, and that is worth an alert rather than a log line.
A null recorded as a zero. Covered above and worth repeating because it is retroactive: by the time anyone notices, the chart has been wrong for as long as the field has been empty.
A short page read as the end. Top of week returned 22 items against a requested 100 in our measurement. Code that treats a short page as exhaustion, or divides by an assumed 100, is wrong in a way that no exception surfaces.
Bot contamination in exactly two of five communities. The uneven distribution is the trap. A pipeline without a bot filter agrees with a filtered one for most communities, so the bug ships green and only distorts the ones running scheduled threads.
Counting posts rather than windows. Two communities compared over one page each are compared over 16.6 hours and 110 days respectively. Always compute and display the window.
Retries eating the budget. The cadence model says 1.35% of the ceiling. An uncapped retry loop says 100%. Count calls, cap retries, and alert on the count rather than on the failure.
Compression requested but not decoded. Setting the encoding header without decoding the body yields bytes that parse as garbage rather than raising, so it presents as a malformed API response instead of a client bug. It is worth a single assertion at the boundary that the decoded body starts with a brace, because the alternative is losing an afternoon to a parser that is working correctly on input that is not what you think it is.
Clock assumptions. Every timestamp the API returns is UTC, and every bug in this area comes from something downstream helpfully converting it. A histogram bucketed in local time will shift as daylight saving changes, producing an activity curve that appears to move by an hour twice a year for no reason anyone can find later. Store UTC, compute in UTC, and convert only at the point of display.
Trusting a metric nobody has looked at. The most common failure is not any of the above; it is a panel that has been quietly wrong for months because nobody had a prior expectation for what it should show. State the number you expect before you build the chart. A figure that cannot surprise you cannot be checked, and one that surprises you is either a finding or a bug, which is exactly the fork worth noticing.
For the broader picture of what else the API supports once this pipeline exists, the data API overview is the hub, and keyword monitoring over webhooks covers the alerting half if you would rather not build that part. If you need the trend-detection layer on top of these metrics, detecting trending topics from the API builds directly on the same stored rows.
Proving the pipeline is right before you trust it
A dashboard that is wrong looks exactly like a dashboard that is right, which is the entire problem with this category of software. Three checks catch most of it, and all three are cheap enough to run continuously rather than once.
Check the collector against itself. Poll the same community twice in quick succession and compare. The second run should fetch a similar number of items and store close to zero new rows. If it stores many new rows, your upsert key is wrong and you are duplicating. If it fetches nothing, your cursor handling is wrong. This one test catches the two most damaging bugs in the whole build and takes a minute.
Check a derived figure against a hand count. Take one community, one day, and count the posts by hand from the listing. Compare that to what your subreddit_daily view reports. They will differ, and the interesting part is by how much and in which direction. Ours differed by the AutoModerator rows, which is how the bot problem surfaced in the first place. A difference you can explain is a passing test; a difference you cannot is the finding.
Check that your filters are actually filtering. This is the one people skip, and it is the one that fails silently. A query with author <> 'AutoModerator' in it proves nothing unless AutoModerator rows exist in the table to be excluded:
select count(*) filter (where author = 'AutoModerator') as bot_rows,
       count(*) filter (where author <> 'AutoModerator') as human_rows,
       count(*) as total
from post
where subreddit = 'Python';
If bot_rows is zero, your filter is not being tested by your data and its correctness is unproven rather than confirmed. Run this before believing any filtered metric, and pick a community where the thing you are filtering is known to exist. A filter that has never had anything to remove is not a working filter, it is an untested one.
The general principle behind all three is that a check which cannot fail proves nothing. It is worth writing each of these so that you know what a failure looks like before you run it, because a check whose failure mode you have not imagined will be read as a pass whatever it returns.
What the first month actually looks like
Expectations are the last thing worth setting, because the first weeks of a collection pipeline are less immediately rewarding than people assume and that is when most of them get abandoned.
Day one gives you three of the five metrics. Velocity, top hour and comment ratio all work from a single pull, so the dashboard has real content immediately. Growth and decay show nothing, because both are deltas and you have one reading.
Week one gives you growth, and it will look noisy. Subscriber counts move in small increments against large bases, so a daily delta on a million-member community is a rounding artifact as much as a signal. Seven daily snapshots is enough to see a trend line and not enough to trust a single day's number, which is a good reason to display growth as a trailing average from the start rather than adding smoothing later after someone has already misread a spike.
Week two is when the first real bug usually surfaces, and it is usually the page-overflow one. A busy community will have filled its page between two polls at least once, and if you instrumented fetched against new_rows you will see it as a run that stored close to 100. If you did not instrument it, you will not see it at all, which is the argument for that instrumentation being in the first version rather than the second.
Month one is when the pipeline starts being worth more than the tools you could have bought, because you now have a month of history that no hosted product would have retained for you at the granularity you chose. It is also the point where the storage question becomes real, and the answer is reassuring: a 100-post page is roughly 190 KB decoded, so a community polled hourly generates on the order of 4.5 MB of raw payload a day before compression, and twenty communities for a month lands in the low single-digit gigabytes. That is small enough that keeping raw payloads is a straightforward decision rather than a tradeoff.
The thing that makes month one feel different from day one is not the volume of data. It is that the questions change. On day one you ask what the numbers are. By month one you ask why one of them moved, and that question is only answerable if you kept enough to look back at, which is the argument this whole guide has been making in different forms since the schema section.
Verdict
A Reddit analytics dashboard is three days of work and a small table, not an integration project. The API gives you two endpoints worth polling, and the five metrics people actually want all fall out of the rows you store from one of them.
The decisions that determine whether it works are not the ones that feel important. Cadence matters, and it cannot be a single number when one page of posts covers 16.6 hours in one community and 2,639.4 hours in another. Nullable columns matter, because a field that stops populating will otherwise be recorded as a real zero and produce a convincing chart of a decline that never happened. Filtering automation matters, because it moved one community's apparent peak hour by twelve hours in our own measurement. And storing raw payloads matters, because every interesting question in this post was one we thought of after the data was collected.
Cost is not a decision. Tracking 20 communities every 15 minutes is 1,940 calls a day, 1.35% of a documented ceiling, and the only realistic way to exceed that budget is a retry loop.
The build order that gets you there fastest is not the order the metrics are listed in. Ship the collector and the post table first and let it run for a day before writing a single query, because a pipeline with no data makes every query look broken and you will spend the day debugging the wrong layer. Then add velocity, top hour and comment ratio, which all work from one pull and give you a dashboard with real content by the end of day two. Growth and decay come last, not because they are harder but because neither means anything until the history exists. Instrument fetched against new_rows from the very first version, since it is one integer and it is the only thing that will tell you the collector has started silently missing posts.
The honest limitation is history. Nothing you build can tell you what a community looked like last year, because no endpoint returns it, and that is the one gap a hosted tool with an existing archive can fill and you cannot. It is also the reason to start collecting today rather than when the question arrives.
Every call in this guide is documented at docs.redditapis.com, and you can sign up and have the polling loop above storing rows in an afternoon. If your first pass disagrees with a number you expected, check the window and the bot filter before you believe either one.
Where these numbers come from.
Each row is a figure in this post and the artefact it was read from. Reddit's access rules and the third-party archives around them keep moving, so check the date on a source before you build against it.
- Reddit Data API documentation
- Endpoint reference for listings and about records, the two surfaces this build uses. Retrieved 2026-08-31.
- Reddit Data API Wiki
- Reddit's own description of the OAuth request budget the call-cost model is measured against. Retrieved 2026-08-31.
- Reddit Data API Terms
- Governs programmatic collection of the public data used here. Retrieved 2026-08-31.
- Introducing the Responsible Builder Policy
- Reddit's own announcement that self-service access to the public data API closed and approval is now required. Dated 2025-11-11.
- Our plans for the future of Reddit's public data
- Reddit staff statement on restricting new requests and porting third-party apps to the Developer Platform. Dated 2026-08-05.
- Are weekly visitor and contributor counts available in json or API?
- Establishes that moderator-visible visitor and contributor figures are not exposed through the public API. Dated 2025-10-02.
- What is easiest way to track keywords by subreddit over time?
- Practitioner thread on the exact tracking problem this build solves. Dated 2025-01-30.
- Three month update, polling a subreddit's listing daily
- A public worked example of daily listing polling over 8,885 posts, including a documented disagreement with moderator tooling and a hand-verified error bound. Dated 2026-02-26.
- PRAW documentation
- The Python client whose listing helpers wrap the same endpoints used here. Retrieved 2026-08-31.
Frequently asked questions.
No. There is no analytics endpoint on the public Reddit data API, and no aggregate metrics surface for a subreddit beyond the subscriber count on its about record. The weekly visitor and contributor figures moderators see in their own tooling are not exposed publicly, which a direct r/redditdev question established. Everything else in this guide is derived: you fetch post listings, store them, and compute metrics from your own rows. That is why the storage schema matters more than the API calls do.
Often enough that a single page of 100 posts never fills up between polls, which is a per-community number rather than a global one. Measured on 2026-08-31, 100 posts covered 16.6 hours in r/SaaS and 2,639.4 hours in r/redditdev. Halving the measured window gives a safe interval, so roughly 8 hours for r/SaaS against 1,318 hours for r/redditdev. In practice most teams poll everything every 15 minutes because the call budget is generous, and the per-community number matters mainly as a backfill check after an outage.
Tracking 20 subreddits at a 15 minute cadence costs 1,920 listing calls a day plus 20 about calls, for 1,940 total. Against a documented ceiling of 100 requests a minute, which works out to 144,000 a day, that is 1.35%. The expensive workload is not the dashboard, it is any per-user analysis: resolving the authors of one 100-post page costs about 97 additional calls, which is why author-level work belongs in a scheduled job rather than a refresh.
Two tables and the raw payload. A posts table keyed by post id, holding the score, comment count, author, created timestamp and the time you read it, upserted rather than appended so re-reads update rather than duplicate. A subreddit snapshots table keyed by subreddit and observation time, holding the subscriber count and the HTTP status of the read. And, for as long as you can afford it, the raw response bodies, because they are the only thing that lets you answer a question you had not thought of yet.
Divide the number of posts by the time window their timestamps span, rather than counting posts per calendar day. Using the window makes the figure comparable across communities of very different sizes, because a fixed count of 100 posts samples radically different periods. Measured this way on 2026-08-31, r/SaaS ran at 144.80 posts per day and r/redditdev at 0.91, a 159x spread. Compute it from stored rows over a window you choose, not from whatever a single API page happened to return.
Almost certainly because a scheduled bot is in your data. AutoModerator wrote 31 of the 100 newest posts in r/Python when we measured, and because it posts at a fixed time those posts land in one UTC hour bucket. The unfiltered histogram put r/Python's peak at 00:00 UTC with 32 posts; excluding AutoModerator moved the real peak to 12:00 UTC with 8. Filter known automation accounts by author name before bucketing, and remember the contamination is uneven: three of the five communities we measured had none at all.
Build when you need a metric nobody sells, need the raw data retained, or need the numbers to be auditable. Buy when you need alerting and a UI tomorrow and the standard metric set is enough. The strongest argument for building is durability: when a widely used hosted Reddit research tool shut down in November 2025 after failing to reach a commercial API agreement, its users lost their tooling and their history at once. A pipeline you own keeps its history regardless.
Only what the listing endpoints will still serve, which is a rolling window rather than an archive. This is the single biggest constraint on a homegrown dashboard: your history starts the day you begin collecting. There is no call that returns last year's post volume. That is also the strongest argument for starting collection before you need the data, because the cost of storing it is trivial next to the cost of not having it.
Re-read the same post ids on a schedule and store each reading with its timestamp. A post's score and comment count are live counters, so a single read tells you the value at that instant and nothing about the curve. Reading each post again at fixed offsets after creation, for example at one hour, six hours and twenty-four hours, gives you the shape. This is the one metric that requires re-fetching rather than a single pass, and it is cheap because you can batch ids.
It varies enough to be a useful metric in its own right, and you compute it as distinct authors per hundred posts. Measured across 500 posts on 2026-08-31, r/webdev returned 99 distinct authors per 100 posts while r/datascience returned 60. A figure near 100 means almost nobody posts twice in the window, which is a broad conversation. A figure in the sixties means a smaller group is doing the posting. Exclude AutoModerator before computing it, because one automation account writing many posts pushes the ratio down and makes a community look more concentrated than it is.
It can be accurate enough to disagree with Reddit's own moderator tooling and be defensible. One analyst who polled a subreddit's listing daily for three months and published the result was told by a moderator that the numbers conflicted with the mod dashboard, and responded by hand-verifying that the last 500 posts appeared in the dataset in the correct order with an overcount under 1%. Two measurement methods disagreeing does not mean one is broken. It usually means they count different things, and the one that documents its method is the one you can check.
Keep reading.
Continue exploring related pages.
Reddit API documentation
The complete 2026 reference: auth, all 59 endpoints, and code.
Get a Reddit API key
Instant bearer token, no waitlist and no enterprise contract.
Reddit Responsible Builder Policy
Why Reddit denies API applications, and the managed REST bypass.
Reddit API use cases
14 use cases from AI training to brand monitoring and DMs.
Reddit Search API
Search posts, comments, users, and communities over one REST endpoint.
Reddit MCP server
Wrap the REST API as MCP tools for Claude, Cursor, and any MCP client.
Reddit MCP hub
Install tabs for every client, the full tool table, pricing and fixes.
Reddit API for AI agents
Live Reddit context for tool calls, MCP servers, and RAG pipelines.
Redditapis pricing
Endpoint-level costs and quick monthly totals - reads from $0.0015 / call.
Reddit API cost calculator
Estimate monthly spend using your request volume.
Reddit API guides and tutorials
Tutorials, walkthroughs, and API deep-dives for developers.
Reddit API alternatives
Evaluate alternatives by cost model, limits, and integration fit.
Cheap Reddit API
The cheapest way to get Reddit data: $0.0015 per call, no contract, no minimum.
Official Reddit API vs Redditapis
Access, setup, rate limits, and pricing, side by side.
PRAW alternative
A hosted Reddit REST API for any language, no app registration or OAuth.
Reddapi alternative
A maintained Reddit REST API with published pricing and write endpoints.
Reddit comment scraper alternative
The raw comment API: search and filter comments, historical and live, clean JSON.
Reddit scraper API
Hosted scraper API vs building your own: no proxies to manage, clean JSON.
RapidAPI Reddit alternative
A direct, maintained Reddit API with published pricing and write endpoints.
Bright Data Reddit alternative
A purpose-built Reddit API vs a general scraping platform: structured JSON, plus writes.
ScraperAPI Reddit alternative
A Reddit-native API vs a generic HTML fetcher: auth and pagination handled, typed JSON.
TikHub alternative
TikHub's Reddit surface is read-only; get comment, vote, and DM endpoints too.
EnsembleData alternative
No $100/month floor: pay per call from $0.0015, plus write, vote, and DM endpoints.
Scrape Creators alternative
7 read-only Reddit endpoints vs a dedicated API with real write, vote, and DM paths.
FetchLayer alternative
Posts, comments, and search only; add vote, comment, and DM over the same REST auth.
PullPush alternative
PullPush is free but volunteer-run and goes offline for reindexing; a maintained REST API that stays up.
Reddit monitoring API
Build your own keyword and brand-mention monitor: search, comment search, and subreddit streams over REST.
F5Bot vs Redditapis
F5Bot's Slack and Discord delivery needs its $49.99/mo Gold tier; Redditapis includes it from $19/mo.
Syften vs Redditapis
Syften caps you at 100 to 500 results a day; Redditapis allows 10,000 a day per monitor at the entry plan.
Octolens vs Redditapis
Octolens meters by mention with overage fees; Redditapis is flat-priced by subreddit slot from $19/mo.
Affiliate program
Earn 20% lifetime commissions - capped at $5,000/yr.
Reddit Vote API tutorial
Upvote and downvote a post programmatically via the REST API.
Reddit Data API: REST, no PRAW
REST endpoints for Reddit data with no PRAW and no OAuth dance.
Reddit scraping benchmarks
Real throughput, error rates, and cost benchmarks for Reddit scraping.
Reddit API answers
Direct answers on cost, access, rate limits, endpoints, and auth.
How much the Reddit API costs
Per-call pricing from $0.0015 a read, with $0.50 in free credits.
Reddit API in Python
One requests call with a bearer token, no PRAW and no OAuth flow.
Reddit shadowban checker
Check if a Reddit account is shadowbanned in seconds, free and no login.
Subreddit stats checker
See any subreddit's live subscriber count, active users, and age, free and no login.
Similar reads.
More guides on the Reddit API, scraping, pricing, and MCP servers.

The Subreddits AI Agent Builders Actually Use: 24 Communities, Measured
Five curated lists rank the best subreddits for AI agent builders and none of them measured anything. We pulled 24 communities and 2,400 posts and ranked them on data.

Building a Reddit Dataset From the API: What You Get That a Static Dump Does Not
The public archives ship monthly. We measured what one live call returns instead: 1,000 posts across ten communities, 22 fields each, a median newest record 12 minutes old, and 496 of those rows already changed 11 minutes later.

Reddit Demographics in 2026: What the API Tells You About Reddit Audience Research
Reddit has never exposed age, gender or income. Here is what the public data API does return, the five behavioural proxies you can build from it, and where each one breaks.
Reddit Stops New Data API Requests on October 31: What to Do If You Have Not Applied
Reddit stops accepting new Data API requests on October 31, 2026. What closes, why the request form keeps failing, and how a new project reads Reddit after.

Reddit RSS Feeds End November 13, 2026: What Breaks and What Replaces Them
Reddit stops supporting RSS feeds on November 13, 2026. What breaks, what Reddit offers moderators instead, the 2027 API dates, and how to replace a feed.

How to Estimate Your Reddit API Bill: a Per-Call Cost Model in Python
A per-call Reddit API cost model in Python: price every read, write and DM, then size the monthly bill for a keyword monitor, a RAG refresh and a reply bot.

Reddit API Limitations in 2026: What the API Will Not Do, Beyond Rate Limits
Every Reddit API ceiling that is not a rate limit: the 1,000-item listing cap we measured, search depth, deleted content, access approval and commercial terms.

Subreddit AI-Rule Index 2026: 52.8% of the 250 Most Popular Subreddits Prohibit AI-Generated Posts or Comments
We read the rules of the 250 most popular subreddits. 132, or 52.8%, prohibit AI-generated posts or comments. 27 of the 50 largest do. 9 require disclosure.