
Reddit Demographics in 2026: What the API Tells You About Reddit Audience Research
Reddit has never exposed age, gender or income. Here is what the public data API does return, the five behavioural proxies you can build from it, and where each one breaks.

Reddit has never told anyone how old its users are.
TL;DR: The public Reddit data API returns no age, gender, income or location, and never has. Every demographic figure in circulation comes from a survey panel rather than from Reddit. What you can derive is behavioural: community size, activity rhythm, account-age cohorts, cross-community overlap and contribution concentration. We measured all five on 2026-08-31 across 20 communities and 500 posts. The live
UTC to 12 UTC once automation is filtered out.active_user_countfield returned null in 20 of 20 communities, every request answering HTTP 200. And 31 of the 100 newest posts in r/Python came from AutoModerator, which moves that community's apparent peak posting hour from 00
That single fact is missing from almost every article that ranks for this query, and it changes what the rest of them are worth. The age brackets, the gender split, the income bands: none of those numbers came out of Reddit. They came out of survey panels run by research companies, were republished by aggregators, and then got quoted by marketing blogs until they acquired the texture of platform data. Reddit's public API has never carried a demographic field, and as of our measurements on 2026-08-31 it still does not.
This post is about what you can actually learn instead. We queried the about record for 20 communities, pulled the 100 newest posts from five of them, and resolved 25 author profiles, all through the public data API on 2026-08-31. Every number below is either measured in that pass, derived from it with the arithmetic shown, or cited to a named third party with a retrieval date, and each one says which it is.
Not affiliated with Reddit Inc. redditapis.com is an independent third-party REST proxy for Reddit's API. This guide is vendor-neutral: it says plainly what Reddit does and does not provide, names the limits of our own measurements, and points at the places where the honest answer is that the data does not exist.
TL;DR
Reddit's public data API has never returned age, gender, income or location for a user, and it still does not in 2026. Every age bracket you have read in a Reddit statistics roundup comes from a third-party survey panel, not from Reddit. What the API does return is behavioural: subscriber counts, post and comment timestamps, account creation dates, karma totals and the full authorship of any listing. From those you can build five real audience proxies, and we measured all five across 20 communities and 500 posts on 2026-08-31. Two findings matter most. The live active-user field returned null in 20 of 20 communities we queried, every one of them answering HTTP 200, so the one engagement number the API used to expose is now empty. And 31 of the 100 newest posts in r/Python were written by AutoModerator, which moves that community's apparent peak posting hour from 00:00 UTC to 12:00 UTC once you filter automation out. An unfiltered activity histogram does not describe humans.
What demographic data does the Reddit API actually return?
None. There is no age field, no gender field, no income field and no location field on any object the public Reddit data API returns, and there never has been in a documented version. A user profile carries an account name, an id, a creation timestamp, karma totals split between links and comments, and a set of status flags such as verified, is_mod and is_employee. That is the entire surface. Reddit does not ask its users for a birth date at signup, so it does not have most of these attributes to expose in the first place.
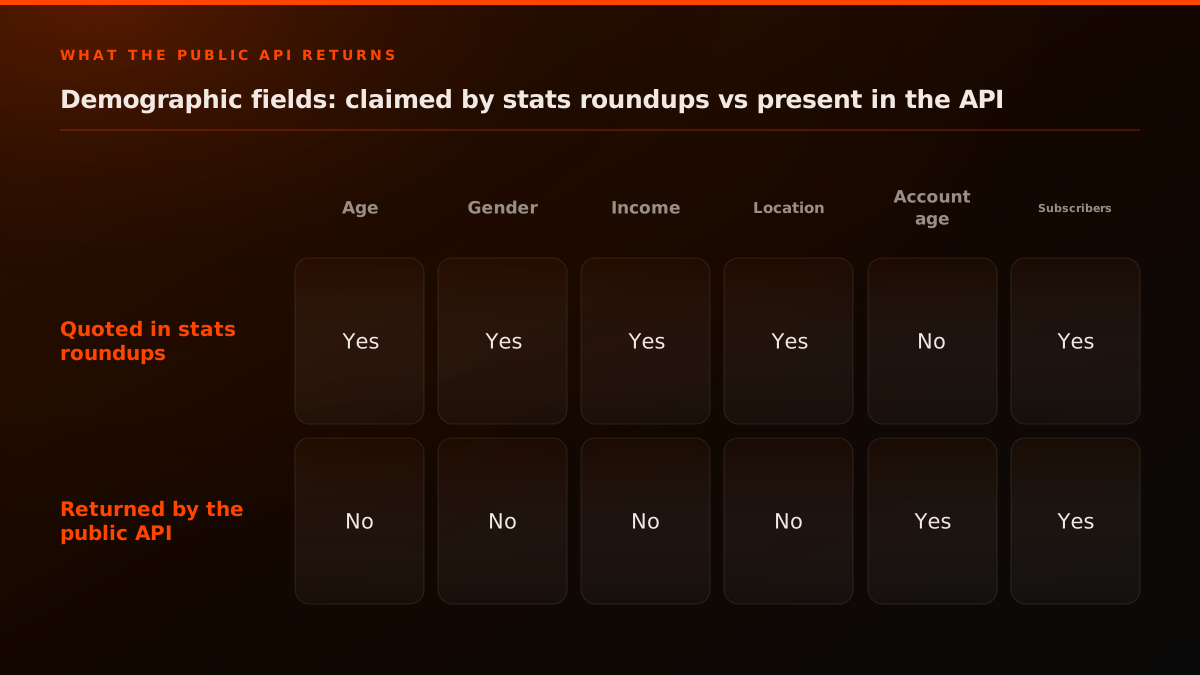
The gap in that grid is the whole story. Age, gender, income and location appear in every published Reddit statistics page and in none of the API responses. Account age and subscriber count run the other way: they are available to anyone with a token and are almost never used, because they do not answer the question a marketer walked in with.
Every field the public API returns about an account
DEMOGRAPHIC FIELDS
0
IDENTITY FIELDS
3
BEHAVIOURAL FIELDS
5
Field list read from a live profile response on 2026-08-31. Counts describe what the endpoint returns, and the two red rows are the whole reason a Reddit demographics article has to cite a survey company.
The Reddit Data API documentation is the place to confirm this rather than take our word for it, and the same shape is visible in PRAW's attribute surface, since the client mirrors the response. We have written separately about the fields the user endpoint returns, and the short version is that a Reddit account is deliberately thin: the platform's pseudonymity is a product decision, and the empty demographic surface is a consequence of it rather than an oversight.
Where do published Reddit demographic statistics come from?
They come from survey panels, and mostly from one. The age and gender figures circulating in Reddit statistics roundups trace back to a small number of primary sources, of which Pew Research Center's social media fact sheet is the most cited and the most rigorous, alongside commercial panels resold through aggregators. Those are surveys of people, asking which platforms they use. They are not measurements of Reddit.
This distinction is not pedantic, because the two produce different numbers and the difference trips up careful readers constantly. A Pew table reports what share of Americans in an age bracket use Reddit. A marketing article converts that into what share of Reddit is in that age bracket. Those are different quantities and one does not follow from the other.
The clearest statement of the problem is not in any of the ranking articles. It is a correction one Reddit user posted to another in r/TheoryOfReddit, on a thread asking whether teenagers still dominate the platform:
Are teenagers still the predominant demography of Reddit?
I feel llike there's two things that I'm seeing here on Reddit. One is that a lot of the users here are supposed to be edgy 14 year olds or something, but also a lot of anecdotes and stories here seem to suggests that a…
"You're reading that table wrong. It says 44% of Americans aged 18 to 29 use Reddit. Not that 44% of Reddit is 18-29 year olds."
That is a base-rate error, and it is load-bearing. The first statement tells you about the population of Americans. The second tells you about the population of Reddit. Converting between them requires knowing how many Americans are in each bracket and how heavily each bracket uses the platform, and it also requires knowing Reddit's non-American share, which no public source pins down well. In the same thread, other participants confidently cited an average age of 23 from an article whose own source for that figure is an uncredited "analysis of over 5,000 Redditors" with no named author or method.
The path from a careful survey to a wrong sentence is short and it has four steps:
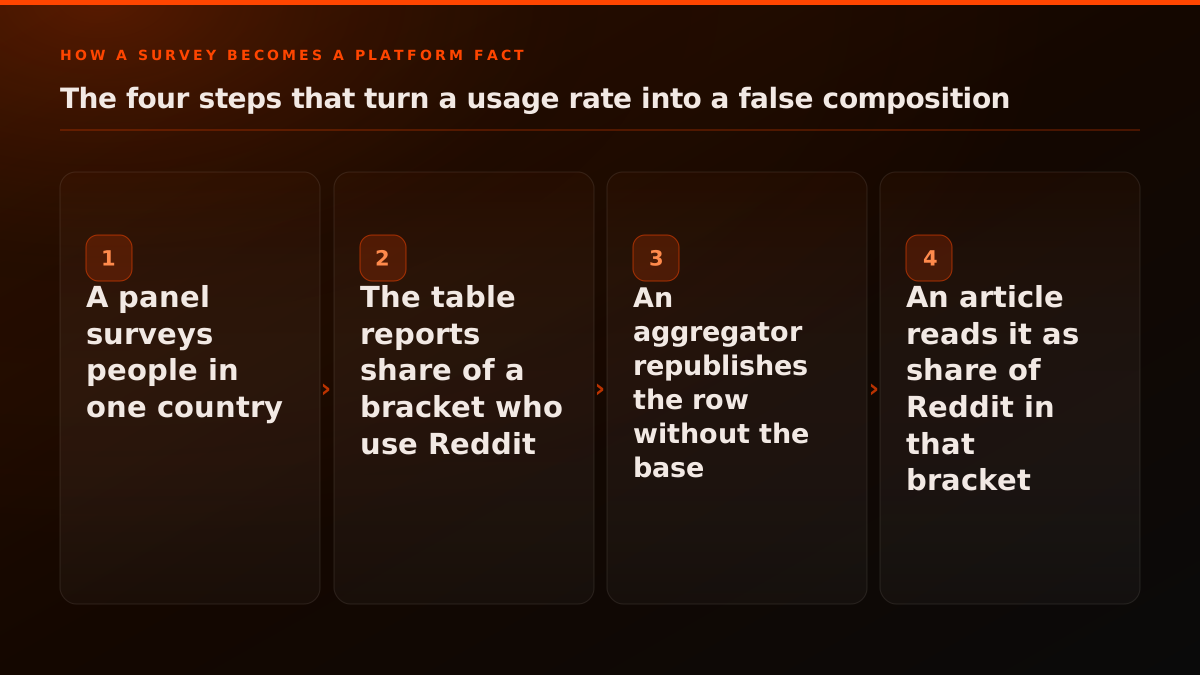
Nobody in that chain is being dishonest. The survey states its method, the aggregator states its source, and the article cites the aggregator. What is lost at each hop is the denominator, and by the last step the sentence has quietly changed meaning.
The same laundering happens with platform-level aggregates. Comparative social-media usage figures circulate widely and are usually sourced to a mix of company filings and panel data rather than to any platform's API:

Benzinga
@Benzinga
When it comes to social media usage in the United States, companies owned by Alphabet and Meta reign supreme based on a new poll. A poll from Pew Research conducted in the first half of 2025 found that YouTube is the most used social media platform in the U.S. with 84% of people… Show more

That kind of figure is fine for what it is, which is a market-level comparison built from disclosed financials and survey panels. It becomes a problem when it is repackaged as an audience insight about who is in a particular community, because nothing in it operates at that resolution.
It is worth walking the inversion through slowly, because it is the single most repeated error in this subject and seeing the shape of it makes it recognisable everywhere.
A survey reports a usage rate: of people in bracket B, what share use platform P. Call that use_rate(B). What a marketer wants is a composition: of the users of platform P, what share are in bracket B. Getting from the first to the second requires the size of every bracket in the underlying population, because the composition is:
share_of_P_in_B  =  use_rate(B) * population(B)
                    ---------------------------
                    sum over all brackets b of
                       use_rate(b) * population(b)
Three things follow from that formula and none of them are obvious from the survey table alone.
First, a bracket can have the highest usage rate and not be the largest group of users, if it is a small slice of the population. A 44% usage rate in a bracket holding 15% of adults contributes less to the total than a 25% rate in a bracket holding 40%. Reading the highest percentage in the table as "the biggest group on Reddit" is wrong in exactly this way, and it is wrong in a direction that systematically overstates the young.
Second, the denominator is a sum over the whole population, so you cannot compute any single bracket's share without usage rates for all of them. An article quoting one row of a survey table has by construction not done this calculation, whatever number it prints.
Third, and most damaging, the survey population is usually one country. Reddit is not one country. A US-only usage survey tells you nothing about the composition of a global user base unless you also know the US share of that base, and no public source pins that down with any confidence. Every "Reddit is X% aged 18-29" claim that traces back to a US survey has quietly substituted "American Reddit users" for "Reddit users" somewhere in the chain.
None of this means the survey data is bad. Pew's methodology is published and careful, and the fact sheet states exactly what it measured. The failure happens downstream, in the retelling, and it is why one commenter in that thread had to spend a comment correcting another rather than adding to the discussion.
That correction, incidentally, is a better piece of analysis than most of what ranks for this query, and it is sitting in a comment thread where no answer engine is likely to surface it. The people who have actually thought carefully about Reddit demographics are largely on Reddit, arguing with each other about how to read tables.
A second source of confusion is that Reddit itself has been reducing the numbers it shows. In September 2025 the platform began removing visible subscriber counts from parts of its interface, which set off a long r/technology thread and a direct question in r/redditdev about whether the field would survive in the API. One commenter's reaction captured why the change unsettled people who use those numbers:
"Why not include both. What are you trying to hide reddit"
Whatever the reason, the practical effect for anyone building on this data is that the platform's own display of aggregate audience figures is shrinking rather than growing, and the API is the surface that still answers. Developers asked the obvious follow-up question directly, which is whether the field would survive where they actually consume it:
Is subscriber count staying in the Subreddit-related endpoints?
This [announcement](https://www.reddit.com/r/modnews/comments/1ncn0go/evolving_moderation_on_reddit_reshaping_boundaries) says that Subreddits won't display the subscriber counts anymore. I can see that these changes…
It has, so far. Subscriber count is still returned by the about record, and it remains the single most reliable number in this whole subject. It is also the number with the widest spread, which is worth seeing before you compare two communities on it:
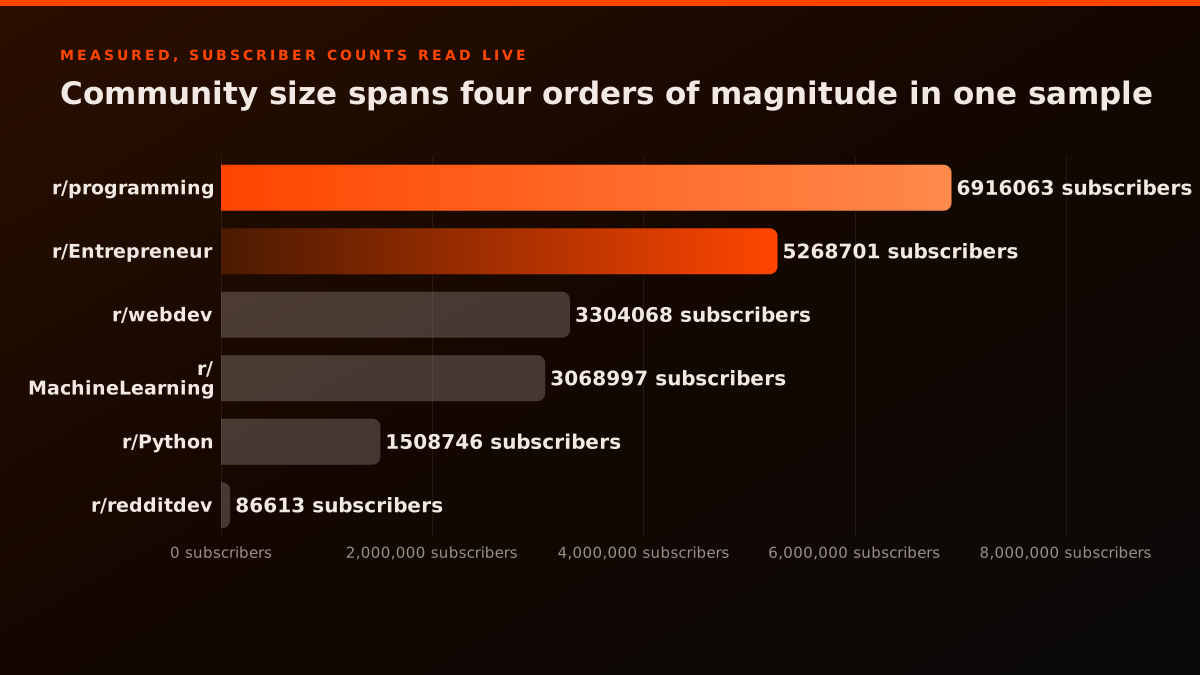
The 20 communities in our sample run from 6,916,063 subscribers down to 86,613, four orders of magnitude, and every one of them returned the same null for the active-user field. That range matters for the finding: if the empty field were a size-related quirk, a sampling frame this wide would have caught it.
Is active_user_count still returned by the Reddit API?
No, not with a value. We queried the about record for 20 communities on 2026-08-31, spanning from 6.9 million subscribers down to 86,613, and from communities created in 2006 to one created in 2023. Every request returned HTTP 200. The active_user_count field came back null in 20 of 20.
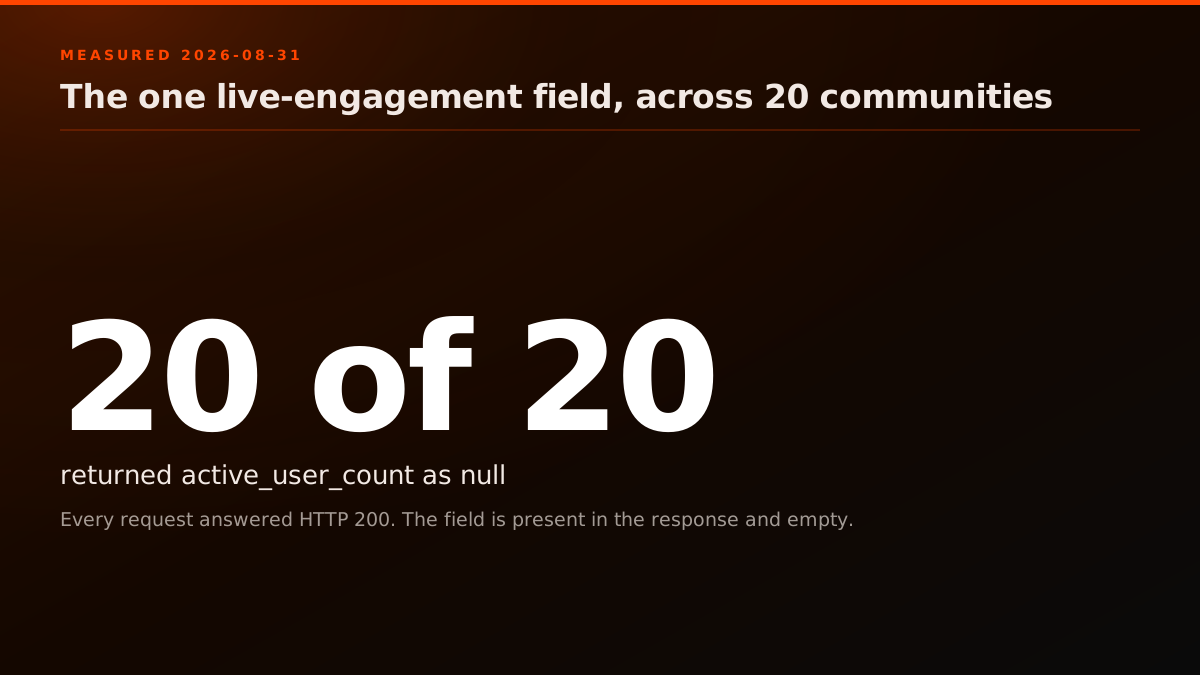
The distinction that makes this finding worth reporting is that these were not failed calls. A failed call returns an error status and no body. These returned a complete about record with subscriber counts, creation dates and descriptions all populated, and one empty field sitting among them. The field is still in the response shape; it just carries nothing.
Here is the raw pass rather than a summary of it:
The about record across 20 communities, read in one pass
| Community | Subscribers | active_user_count | Created | HTTP status | Source |
|---|---|---|---|---|---|
| r/programming | 6,916,063 | null | 2006-02-28 | 200 | measured |
| r/Entrepreneur | 5,268,701 | null | 2008-08-21 | 200 | measured |
| r/webdev | 3,304,068 | null | 2009-01-25 | 200 | measured |
| r/MachineLearning | 3,068,997 | null | 2009-07-29 | 200 | measured |
| r/datascience | 2,765,698 | null | 2011-08-06 | 200 | measured |
| r/startups | 2,121,095 | null | 2008-01-25 | 200 | measured |
| r/marketing | 1,966,395 | null | 2008-03-23 | 200 | measured |
| r/Python | 1,508,746 | null | 2008-01-25 | 200 | measured |
| r/artificial | 1,331,227 | null | 2008-03-13 | 200 | measured |
| r/learnpython | 1,052,041 | null | 2009-10-02 | 200 | measured |
| r/LocalLLaMA | 814,764 | null | 2023-03-10 | 200 | measured |
| r/SaaS | 794,347 | null | 2008-07-31 | 200 | measured |
| r/devops | 510,726 | null | 2010-08-02 | 200 | measured |
| r/dataengineering | 475,378 | null | 2015-02-06 | 200 | measured |
| r/rust | 420,644 | null | 2010-12-02 | 200 | measured |
| r/ExperiencedDevs | 413,628 | null | 2018-01-22 | 200 | measured |
| r/golang | 375,695 | null | 2009-11-11 | 200 | measured |
| r/node | 349,935 | null | 2009-12-16 | 200 | measured |
| r/analytics | 280,773 | null | 2010-02-10 | 200 | measured |
| r/redditdev | 86,613 | null | 2008-06-18 | 200 | measured |
We are not the first to hit this. Developers using PRAW ran into the same wall from the client side and posted about it in r/redditdev, where the attribute simply stopped existing on the object with no changelog entry to explain it:
AttributeError: 'Subreddit' object has no attribute 'active_user_count'
Heya folks, My bot using PRAW has been running uninterrupted for months on end, when all of a sudden it decided to stop working about 40 hours before the time this post was made. The culprit? The subreddit object no…
That thread matters as corroboration because it comes from a completely different code path. Our measurement is a REST client reading a JSON field. Theirs is a Python library raising an AttributeError because the attribute is absent from the parsed object. Two independent routes to the same conclusion is a considerably stronger position than one, and it rules out the most obvious alternative explanation, which is that our own response mapping dropped the field.
What this costs you is real. Subscribers and active users were the two halves of a size reading: one told you reach, the other told you presence. With the second gone, a community's about record tells you how many accounts ever joined and nothing about how many are there now. That is the gap the rest of this post exists to fill, and it is why every remaining proxy is derived from post listings rather than from the about record.
Which audience proxies can you actually build from the Reddit API?
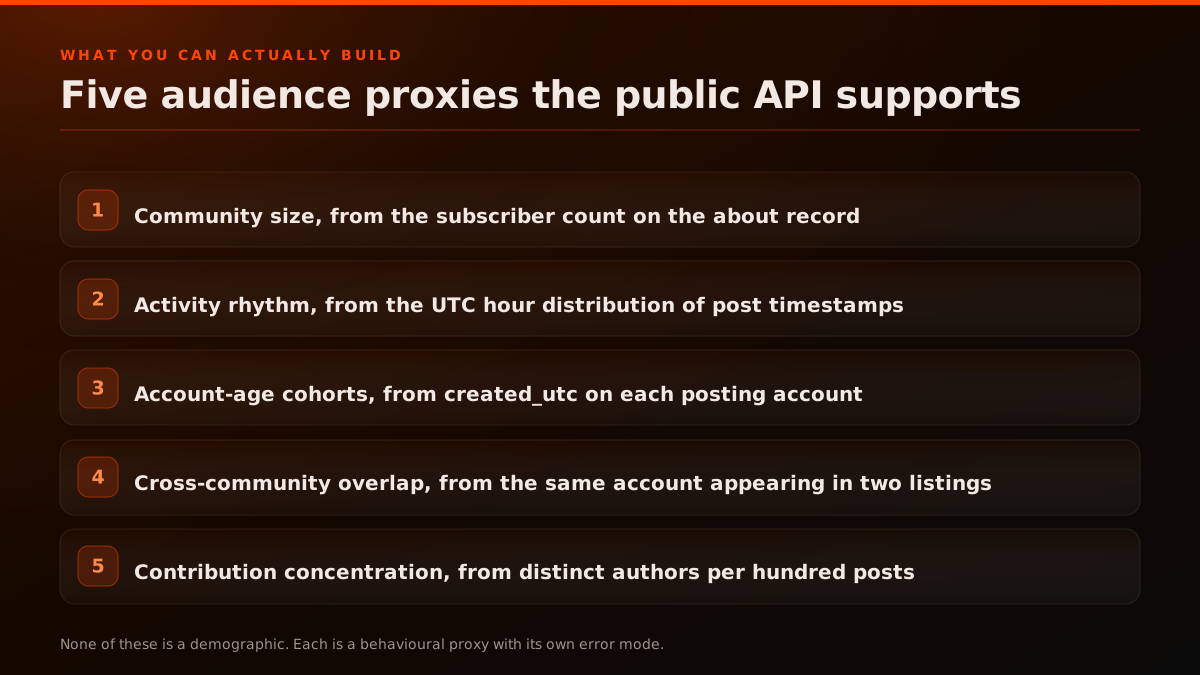
Five, and it is worth being precise that these are behavioural proxies rather than demographics. None of them tells you a user's age, and each carries an error mode you have to design around.
Taking them in order of how much they survive contact with reality:
- Community size, from the subscriber count on the about record. The most reliable number available and the least informative, because it accumulates and never decays.
- Activity rhythm, from the UTC hour distribution of post timestamps. Genuinely useful, and the most easily corrupted, as the next section shows.
- Account-age cohorts, from
created_utcon each posting account. The closest thing to a cohort variable that exists without inference. - Cross-community overlap, from the same account appearing in two listings. Expensive to compute and the strongest interest signal of the five.
- Contribution concentration, from distinct authors per hundred posts. Tells you whether a community is a broad conversation or a handful of prolific posters.
The rest of this post works through each one with the measurement that shows what it is worth.
How do you read a subreddit's activity rhythm, and what breaks it?
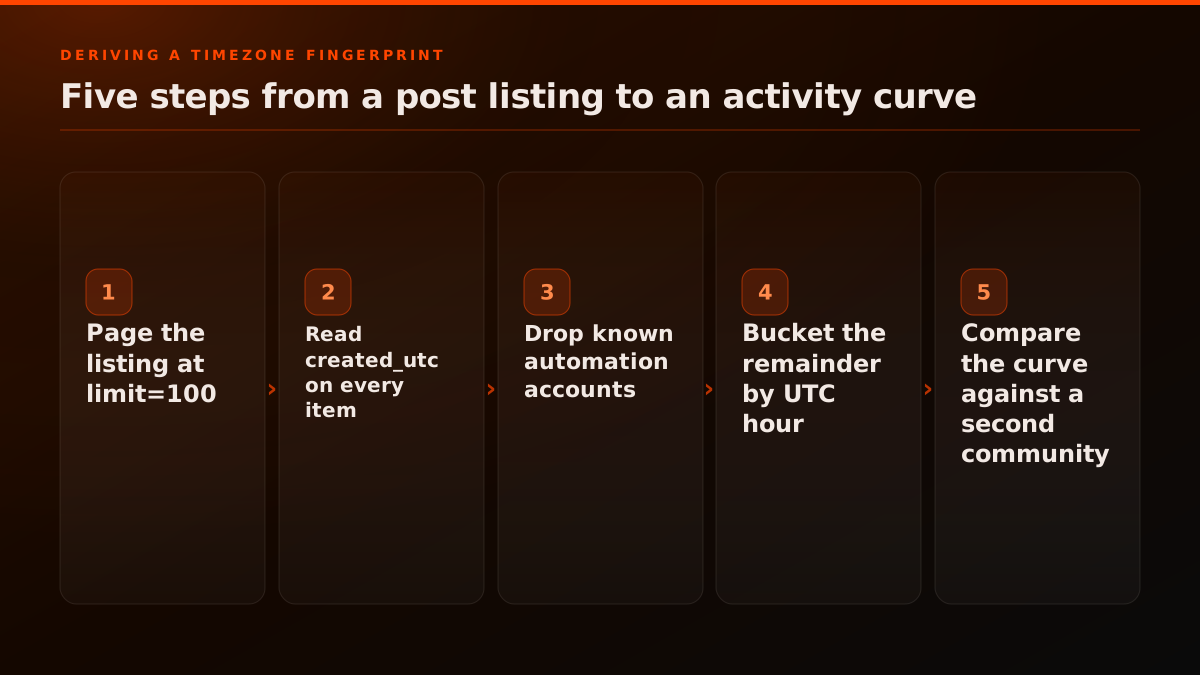
You bucket post timestamps by UTC hour, and the thing that breaks it is bots. Every item in a listing carries created_utc, so a page of 100 posts gives you 100 timestamps and a histogram is one pass away. That histogram correlates with when a community's contributors are awake, which is the closest the API gets to a location signal.
Then we ran it on r/Python and got a result that looked like a finding and was actually an artefact. The unfiltered histogram put the peak at 00
UTC with 32 of 100 posts, more than three times any neighbouring hour. A community with a hard midnight spike is an interesting claim about its audience.It was not an audience. It was AutoModerator, posting the daily thread at 00:00
UTC every day: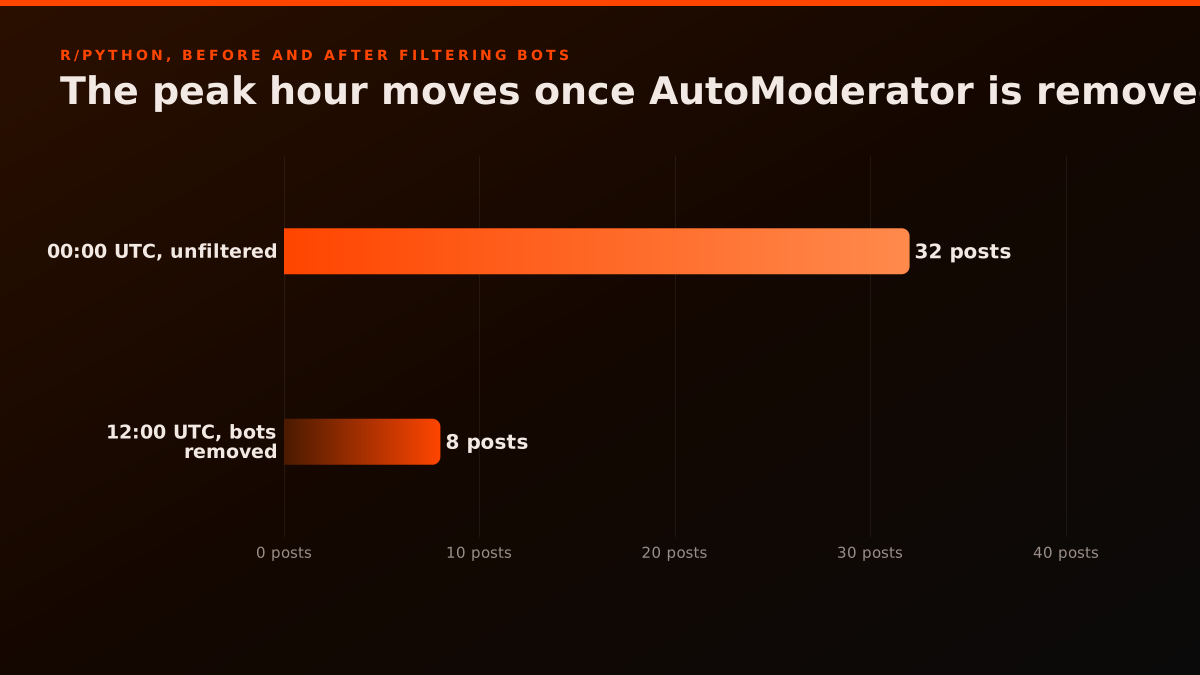
Thirty of those 32 midnight posts came from a single account, and 30 of them landed in the same minute of the same hour, because a scheduled job does not vary. Filtering by author name moved r/Python's apparent peak from 00
UTC to 12 UTC, a twelve-hour error in the one signal people most want from this kind of analysis.The corrected curve is also flatter than the broken one, which is its own lesson:
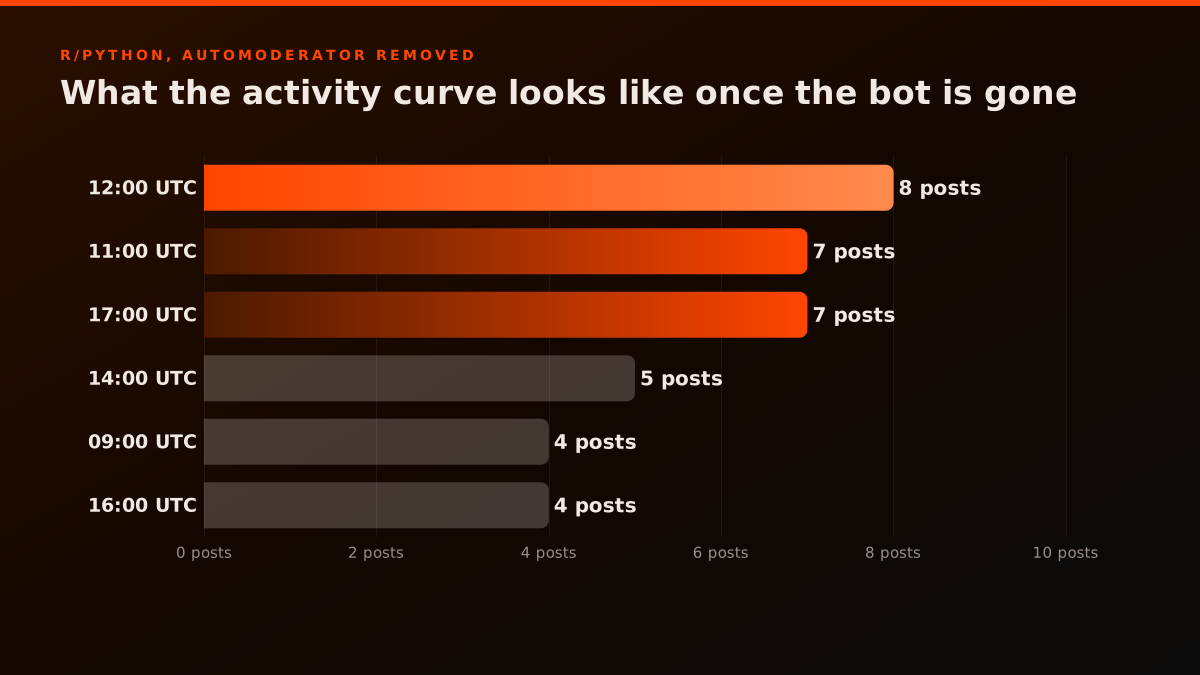
With the bot gone, the top hour holds 8 posts and the next two hold 7 each. There is a real daytime-Europe-into-US-morning bulge, and it is a gentle one. The unfiltered version implied a community with a dramatic single-hour spike, which would have been a genuinely unusual finding and was entirely manufactured by one scheduled job. A histogram with one hour towering over its neighbours is nearly always automation, and that shape is the tell worth learning.
The contamination is not uniform, which is what makes it dangerous:
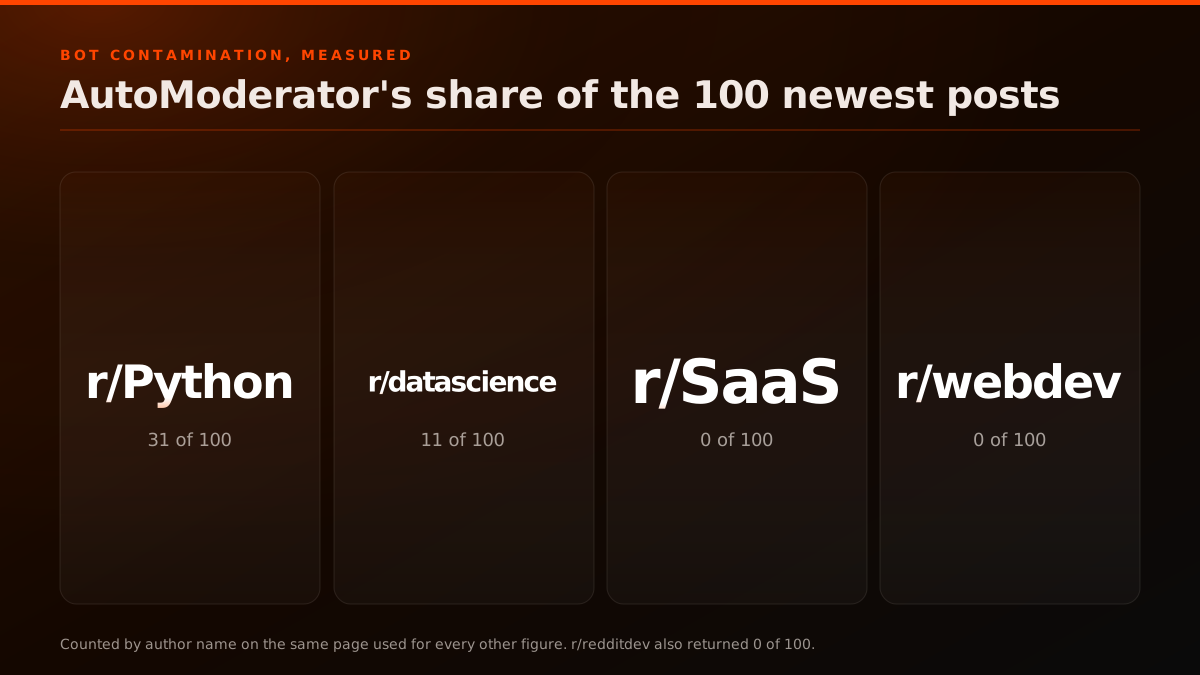
AutoModerator wrote 31 of 100 in r/Python and 11 of 100 in r/datascience, and 0 of 100 in r/SaaS, r/webdev and r/redditdev. A pipeline that filters automation will look identical to one that does not across three of those five communities, which means the bug ships green and only distorts the communities that happen to run scheduled threads. If you are computing anything shaped like a best time to post, this is the correction that matters most, and we have written up the timing question on its own terms separately.
Filtering by author name is the cheap fix and it is not a complete one. AutoModerator is easy because it is one well-known name. Other automation posts under ordinary-looking usernames, and the honest position is that a UTC histogram from a public listing is a probabilistic signal about the people who post, not a measurement of the people who read. One analyst who ran a timezone study across a set of Reddit threads stated the limitation about as well as it can be stated:
"While the timezone analysis strongly suggests Western activity, it is probabilistic, not definitive. It is possible for a small minority of users to use VPNs or work night shifts. However, the aggregate trend remains statistically significant."
That is the right register for this entire category of inference. The signal is real, the confidence interval is wide, and the honest write-up says both.
How far back does one Reddit API call actually reach?
Between 16.6 hours and 2,639.4 hours, depending entirely on the community. This is the sampling trap underneath every Reddit audience comparison, and it is invisible if you think in posts rather than in time.
A listing call returns at most 100 items. That cap is fixed. What is not fixed is how much time those 100 items represent, because a community posting 145 times a day burns through 100 posts in well under a day while a quiet one takes months to accumulate them.
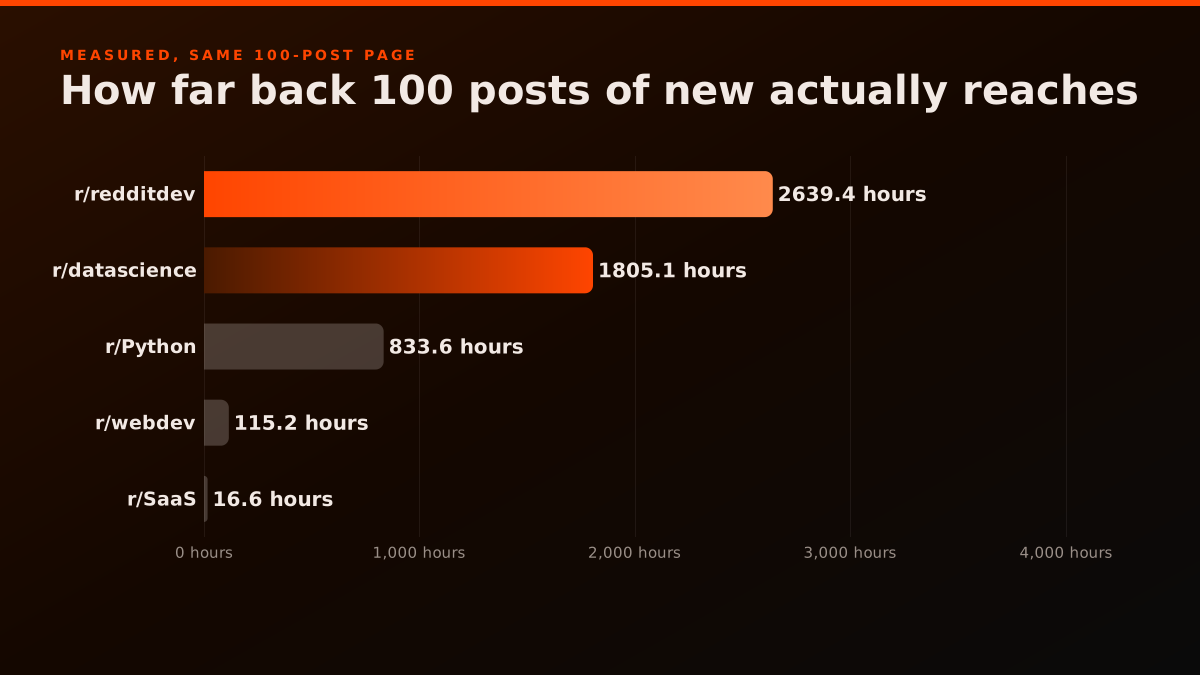
Measured on 2026-08-31 across five communities, one page of 100 posts covered 16.6 hours in r/SaaS and 2,639.4 hours in r/redditdev. That is a 159x difference in observation window from an identical API call. Expressed as velocity it is the same fact from the other side:
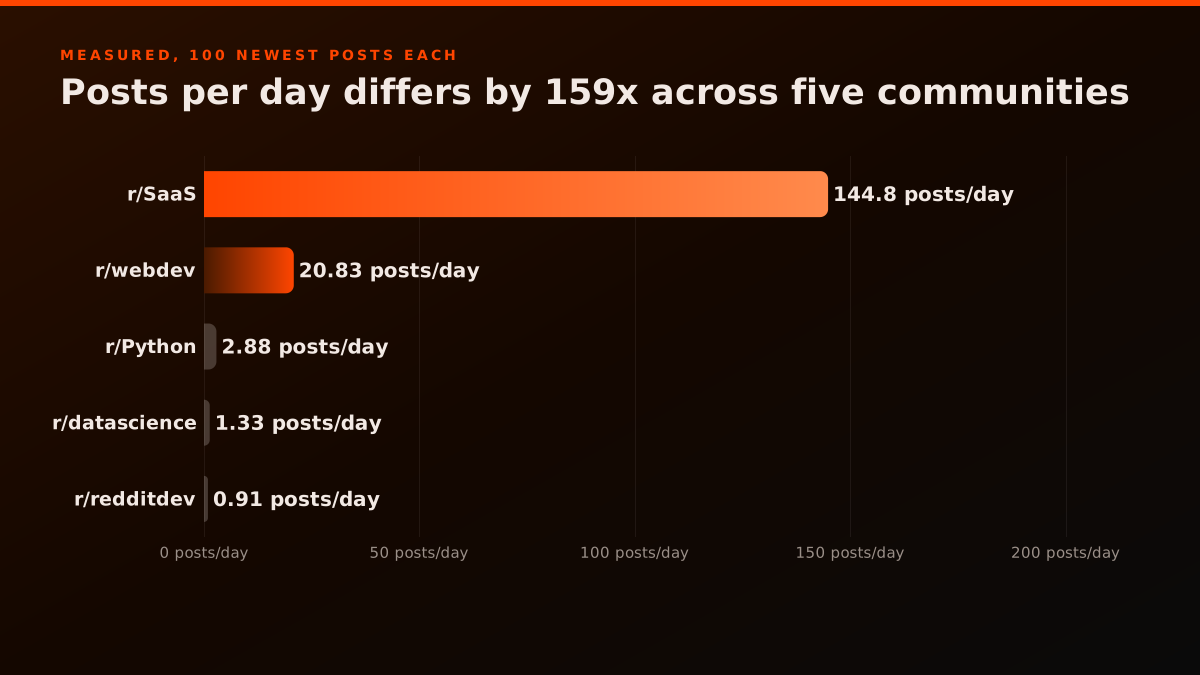
The full page, with the derived figures and the author counts alongside:
What one page of 100 posts actually samples, per community
| Community | Posts returned | Window covered | Posts per day | Distinct authors | AutoModerator posts | Source |
|---|---|---|---|---|---|---|
| r/SaaS | 100 | 16.6 hours | 144.80 | 96 | 0 | measured |
| r/webdev | 100 | 115.2 hours | 20.83 | 99 | 0 | measured |
| r/Python | 100 | 833.6 hours | 2.88 | 66 | 31 | measured |
| r/datascience | 100 | 1,805.1 hours | 1.33 | 60 | 11 | measured |
| r/redditdev | 100 | 2,639.4 hours | 0.91 | 93 | 0 | measured |
The consequence for analysis is blunt. If you pull one page from two communities and compare the results, you have compared 16.6 hours of one against 110 days of the other and called it a like-for-like reading. Every seasonal effect, every news cycle, every weekend, is averaged into one of those samples and absent from the other. This is the same error as comparing two series with different observation windows in any other domain, and it is easy to make here because the API call looks identical both times.
The fix is to decide the time window first and page until you have covered it, recording how many calls that took. That turns a fixed-post-count sample into a fixed-window sample, which is the only kind you can legitimately compare. Paging correctly is its own subject and we have covered how the cursor actually behaves elsewhere, including the part that catches people out, which is that a null cursor does not reliably mean you have reached the end.
Start building with Redditapis
Reads $0.0015, votes $0.005, writes $0.012, DMs $0.025. $0.50 free credits.
What does account age tell you about a Reddit community?
It tells you about tenure, which is the only cohort variable the API hands you without inference. Every user profile carries created_utc, so resolving the authors of a listing gives you an age distribution for the people currently posting in a community.
We took the 100 newest submissions in r/SaaS, found 96 distinct authors among them, and resolved the first 25 against the user endpoint. All 25 returned HTTP 200.
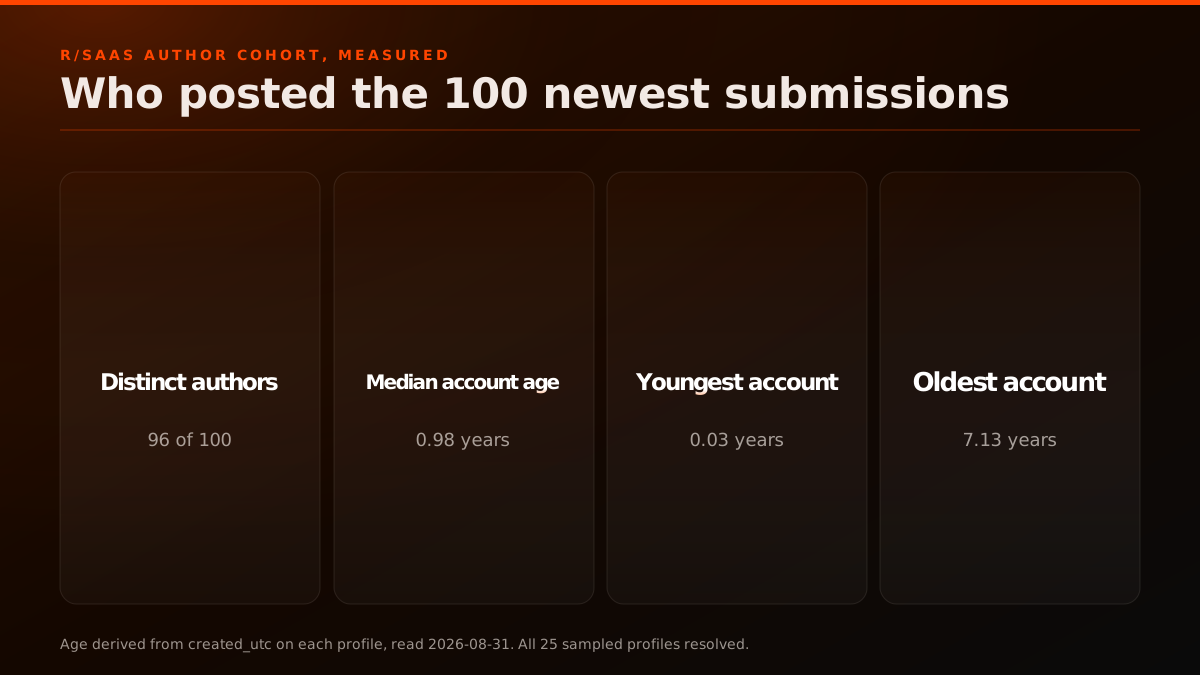
The median account age was 0.98 years. The youngest was 0.03 years, roughly eleven days. The oldest was 7.13 years.
Account-age cohort of everyone who posted the 100 newest submissions in r/SaaS
| Measure | Value | How it was obtained | Source |
|---|---|---|---|
| Posts scanned | 100 | One listing call at limit=100 | measured |
| Distinct authors | 96 | Counted over the same 100 items | measured |
| Profiles sampled | 25 | First 25 distinct non-deleted authors | measured |
| Profiles resolved | 25 | All returned HTTP 200 | measured |
| Median account age | 0.98 years | Derived from created_utc per profile | derived |
| Youngest account | 0.03 years | Derived from created_utc | derived |
| Oldest account | 7.13 years | Derived from created_utc | derived |
A median under a year is a striking number for a community founded in 2008, and it says something specific: the people posting in r/SaaS right now are overwhelmingly not its long-tenured members. Whether that reflects genuine audience turnover, a steady inflow of founders arriving with a new project, or a self-promotional pattern that burns accounts, is a question the API cannot settle. What the API can tell you is that the tenure distribution of posters is very different from what a seventeen-year-old community might suggest.
Two limits are worth stating plainly, because this proxy is the one most likely to be over-read. First, it samples posters, not readers. The overwhelming majority of any Reddit community never posts, and nothing in the public API gives you access to that population. Second, 25 profiles is a small sample from one page on one day. It is enough to notice a pattern and not enough to publish a number about the community as a whole, which is precisely why the figure above is reported next to its sample size rather than on its own.
Karma is the other field on the same response, and it is worth a word because it is the one people reach for as a quality proxy. Karma totals split into link karma and comment karma, which tells you whether an account submits or converses, and both accumulate without decaying. That makes karma a tenure signal wearing a reputation costume: a five-year-old account with modest karma and a one-year-old account with high karma are telling you about volume and time, not about standing. The practical uses of karma are mostly about what a community will let an account do, which is a different subject covered well in this walkthrough:
There is prior work in this shape worth knowing about. One long-running visualisation of Reddit comment frequency split by commenter account age took a random sampling of comments every 30 minutes stretching back to January 2006 and resolved the account age of each commenter, which is the same proxy applied at a scale no single API pass can reach. The technique generalises; the sample size is what separates a hypothesis from a finding.
What does engagement shape tell you that subscriber count cannot?
It separates communities that look identical on paper. Subscriber count is a reach figure, and two communities with similar reach can behave completely differently. The ratio of comments to upvotes is the cheapest discriminator available, and it comes free with any listing page you already fetched.
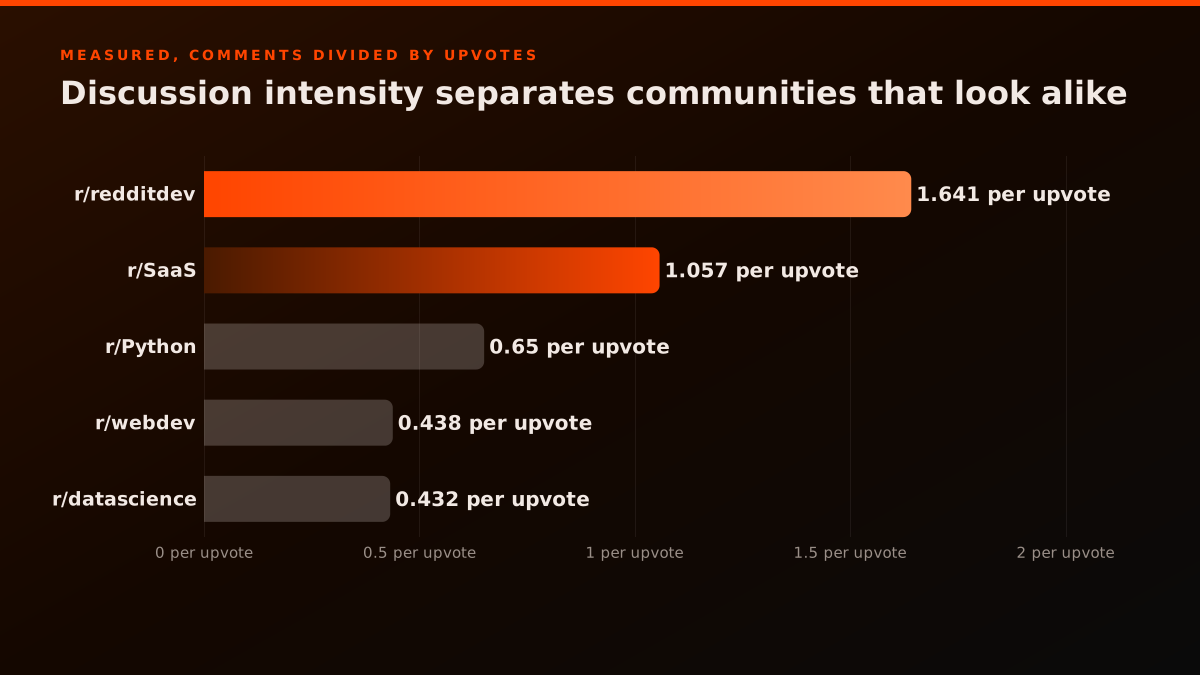
Across the same 500 posts, r/redditdev returned 1.641 comments per upvote and r/datascience returned 0.432, a spread of nearly four times. Those two communities are both technical and both moderated seriously. What separates them is what a post is for: r/redditdev is overwhelmingly people asking questions that need answers, and a question with an answer generates comments rather than votes. r/datascience carries more articles and opinion pieces, which people upvote and scroll past.
Engagement shape of the same 500 posts
| Community | Median upvotes | Median comments | Comments per upvote | Posts with no engagement | Source |
|---|---|---|---|---|---|
| r/datascience | 28.5 | 19.5 | 0.432 | 1 | measured |
| r/webdev | 5.0 | 8.5 | 0.438 | 3 | measured |
| r/Python | 11.0 | 12.0 | 0.650 | 0 | measured |
| r/SaaS | 2.0 | 2.0 | 1.057 | 21 | measured |
| r/redditdev | 2.0 | 4.0 | 1.641 | 6 | measured |
The no-engagement column in that table deserves a caveat rather than a headline, and it is the kind of caveat most published analyses skip. r/SaaS shows 21 of 100 posts with no engagement at all, far more than anywhere else. Part of that is real: it is a high-volume community where a lot of submissions sink without trace. But part of it is an artefact of the sampling window, because a listing sorted by new in a community posting 145 times a day contains posts that are only minutes old and have not had time to be seen. Read in isolation, that 21 looks like a finding about community quality. Read next to the 16.6-hour window, it is substantially a finding about how recently we looked.
That interaction between two columns of the same table is worth internalising as a general habit. A ratio computed over a listing is always partly a statement about the listing's time span, and the only defence is to publish the window alongside the ratio.
Can you map which other communities an audience belongs to?
Yes, and this is the strongest fit signal the public API supports. The mechanism is simple: take the authors of a community you care about, request each one's public submission history, and count which other communities they appear in. Nothing is inferred. Every data point is a post that account actually made.
We ran it on r/SaaS. Thirty distinct non-automation authors were taken from the 100 newest submissions, and each was requested from the user submissions endpoint. Eighteen returned a usable history. Those 18 accounts had posted into 169 distinct communities, with a median of 6 communities per author and one account reaching 45.
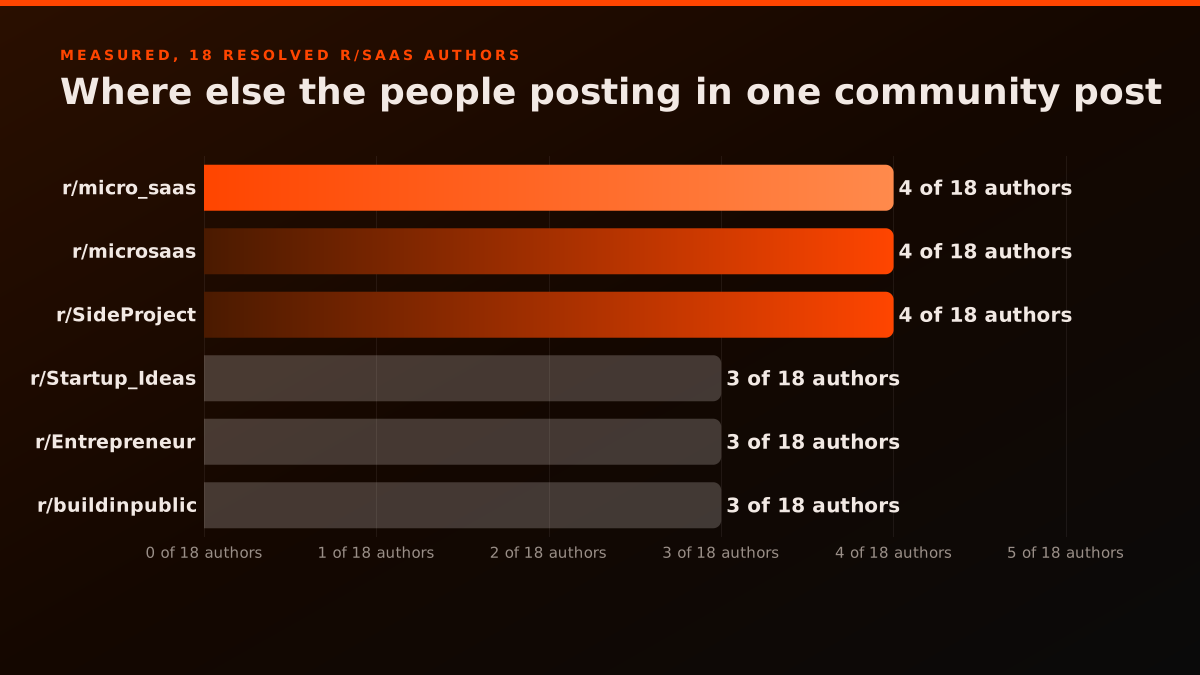
The concentration at the top is the useful part:
Where else 18 r/SaaS posters post, from their own submission history
| Community | Authors who also post there | Share of resolved sample | Source |
|---|---|---|---|
| r/SaaS (the seed) | 17 | 94.4% | measured |
| r/micro_saas | 4 | 22.2% | measured |
| r/microsaas | 4 | 22.2% | measured |
| r/SideProject | 4 | 22.2% | measured |
| r/Startup_Ideas | 3 | 16.7% | measured |
| r/Entrepreneur | 3 | 16.7% | measured |
| r/buildinpublic | 3 | 16.7% | measured |
| r/Business_Ideas | 2 | 11.1% | measured |
| r/Notion | 2 | 11.1% | measured |
| r/nocode | 2 | 11.1% | measured |
| r/ProductHunters | 2 | 11.1% | measured |
What 18 resolved r/SaaS posters actually touch
COMMUNITIES TOUCHED
169
MEDIAN PER AUTHOR
6
API CALLS SPENT
31
Thirty distinct non-automation authors were requested from the user submissions endpoint on 2026-08-31 and 18 returned a usable history. A community appearing for one author out of 18 is noise, not an audience insight.
Three things in that table are worth pulling out, and only one of them is the obvious one.
The obvious one is that the adjacent communities are exactly where you would expect a SaaS founder to also be posting, which is a good sign the method works rather than an interesting finding on its own. r/SideProject, r/Entrepreneur and r/buildinpublic showing up is the method passing a sanity check.
The second is subtler and immediately practical: r/micro_saas and r/microsaas are two different communities, both appearing for 4 of 18 authors. Anyone hand-building a target list would treat that as a typo and merge them, losing half the reach. An overlap map built from data catches near-duplicate communities that a human list does not, and this pattern is common wherever a community has forked or been recreated.
The third is a warning about the tail. r/Animemes and r/Youtubeviews each appear once. With a base of 18, a single occurrence is one person's unrelated hobby, and reading it as an audience insight is exactly the kind of overfitting this method invites. The rule that keeps it honest is that a community appearing for one author is noise until a larger sample says otherwise.
This proxy is also the expensive one, and the arithmetic is worth knowing before you run it at scale. Our pass cost 31 API calls to cover 30 authors from one community: one listing call plus one history call per author. Covering all 96 distinct authors from that single page would cost 97 calls, and doing that across 20 communities would run to roughly 1,940 calls. That is still a small number against Reddit's documented budget, but it is two orders of magnitude more than reading an about record, which is why overlap belongs in a scheduled job rather than in a page load. The companion build guide covers where that job sits.
A practitioner who ran this class of analysis at genuinely large scale described what falls out of it, and the framing is worth borrowing because it is honest about what the signal is:
"Even anonymous users leak a lot through timing, tone, and sub choice."
Sub choice is the strongest of those three, and it is the one this proxy measures directly. It is also the one that decays: the third-party site that used to publish subreddit overlap statistics for everyone stopped updating, which is what people in this space have been working around for years.

Nik
@cointradernik
@tervoooo Shame the data stopped updating since Jan, subredditstats was pure alpha
That is the recurring shape of this whole category. A convenient aggregate exists, people build on it, it goes away, and the only durable option is computing the thing yourself from the primary source.
Which proxy should you actually use?
It depends on what you are willing to spend and what error you can tolerate, and the honest answer is that none of them describes the people who only read.
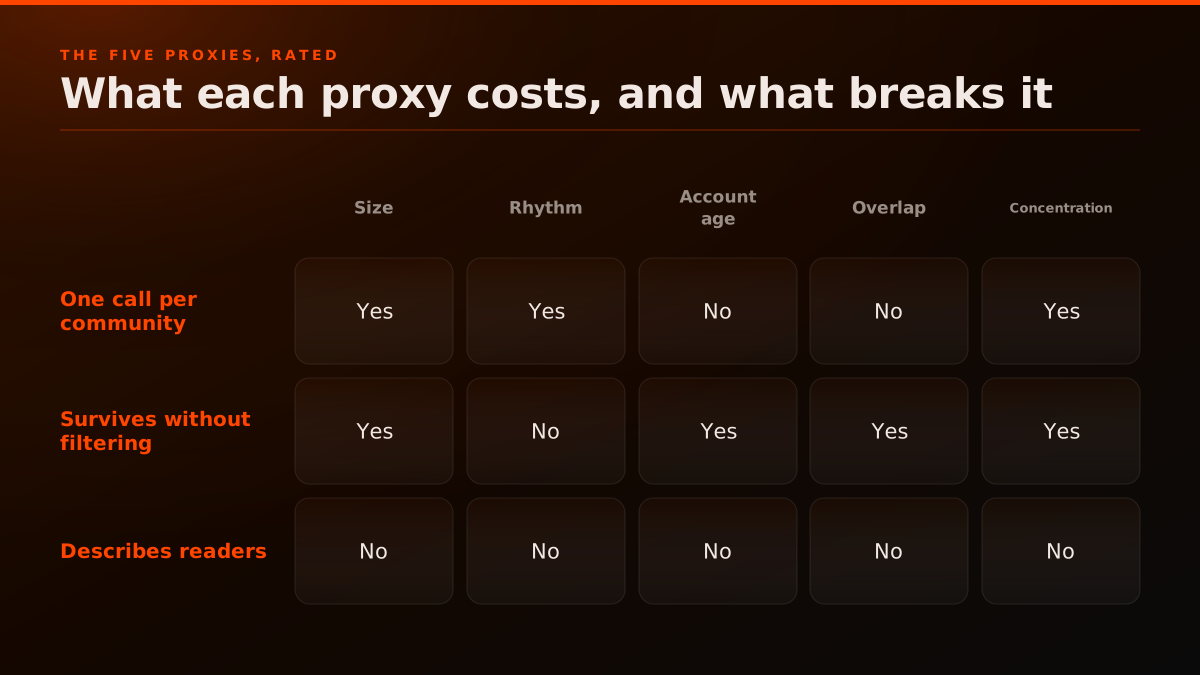
Underneath the scoring there is a simpler question, which is which API call each proxy is actually built from:
Which API field each proxy is actually built from
Four of the five proxies hang off the post listing, and only two need a per-account call, which is exactly why those two are the expensive ones. The about record contributes a single number.
The bottom row of the grid above is all "No", and it is the most important row on the page. Every proxy here measures participants. Reddit's own moderator tooling surfaces weekly visitor counts, those are not in the public API, and a direct r/redditdev question confirmed as much. So the population you can measure is the people who post, and in r/SaaS that was 96 accounts against 794,347 subscribers, which is roughly 0.012% of the community for that window.
The middle row separates the two cheap proxies. Community size and contribution concentration are robust because a bot inflates them only trivially. Activity rhythm is the one that fails silently without filtering, as r/Python demonstrated. Account age and overlap both require resolving individual profiles, which is where the call cost lives.
If you are picking one, pick engagement shape, because it costs a single call you were already making and it discriminates between communities that subscriber counts make look identical. If you are picking two, add overlap, and budget for it properly.
How to store this so a null does not become a zero
Store nullable and record the read, because the failure mode here is silent and retroactive. The active_user_count result is the live example: a field that populated for years now returns nothing, and a schema that cannot represent "no value" will write a zero instead.
create table subreddit_snapshot (
  subreddit          text        not null,
  observed_at        timestamptz not null,
  subscribers        bigint,           -- nullable on purpose
  active_user_count  bigint,           -- nullable on purpose, currently always null
  http_status        int         not null,
  primary key (subreddit, observed_at)
);
Three details in that definition are doing real work. active_user_count is nullable rather than not null default 0, so an absent value stays absent and never becomes a data point. http_status is stored alongside, which is what lets you distinguish a successful read of an empty field from a failed call, and that distinction is the entire basis of the finding in this post. And the primary key is the pair, so you accumulate a history rather than overwriting the latest reading, because every metric worth having here is a delta and you cannot compute a delta from one row.
The query that would have caught the change early is not complicated:
select date_trunc('day', observed_at) as day,
       count(*)                        as reads,
       count(active_user_count)        as non_null,
       count(*) - count(active_user_count) as null_reads
from subreddit_snapshot
where http_status = 200
group by 1 order by 1 desc limit 30;
count(column) skips nulls while count(*) does not, so the gap between those two columns is your answer. A pipeline running that check daily would have seen non_null fall to zero on the day the field emptied. A pipeline storing zeros would have seen a smooth decline to nothing and called it a drop in engagement.
This generalises past this one field. On a platform surface that changes without changelog entries, the instrumentation that matters is not the metric, it is the count of how many reads produced a value at all.
What none of these proxies can tell you
This is the section the ranking articles do not have, and leaving it out is what makes them misleading rather than merely thin.
You cannot get age, gender, income or location per user. Not through a workaround, not through a partner endpoint, not by combining fields. Reddit does not collect most of these attributes and does not expose the rest. Any product claiming per-user Reddit demographics is either modelling them from behaviour, which is a prediction with an error rate, or sourcing them from a survey panel, which is a different population.
You cannot see readers. Every proxy in this guide is built from people who posted or commented. Reddit's own moderator tooling shows weekly visitor and contributor figures, and those are not exposed through the public API, as a direct r/redditdev question established. The population you can measure is the participating minority, and it is not representative of the audience.
You cannot treat a behavioural prediction as a fact. Academic work has trained classifiers on exactly the public fields discussed here, and the peer-reviewed attempt to predict Reddit users' age group from posting behaviour reports an F1 of 0.78 while stating its own limitation directly, that the self-reported age labels used for training may not generalise and that language drift means such models need continual updating. An F1 of 0.78 is a genuinely useful research result and a bad foundation for telling a client what their audience is.
You cannot rely on a field staying. The active_user_count result in this post is the live demonstration. A field that populated for years now returns null, with no changelog. Reddit staff have separately set out plans to restrict new API access and require third-party apps to port to the Developer Platform, describing the older surface as something that "wasn't built for today's scale, automated abuse, or commercial scraping." Anything you build here should treat every field as capable of going empty, and should tell you when it does rather than quietly recording zeros.
That last point is the one with an engineering consequence. A pipeline that stores active_user_count as an integer column with a default of 0 has been recording a null as a zero for however long the field has been empty, and every chart built on it now shows a real-looking decline to nothing. Storing nullable and distinguishing "no value" from "the value is zero" is the difference between noticing this in a day and discovering it in a quarterly review.
The cheapest Reddit API. Try it free.
Reads from $0.0015 per call. $0.50 free credits. No credit card required.
Five mistakes that make Reddit audience analysis wrong
These are the errors we either made ourselves during this measurement pass or caught in the act of nearly making, which is a better filter for what to warn about than a list of things that sound plausible.
Comparing two communities over one page each. Covered above and worth repeating because it is the easiest to commit and the hardest to see. The API call is identical, the response shape is identical, the item count is identical, and the observation windows differ by 159x. Nothing in the data announces the mismatch. The only defence is computing the window from the timestamps every single time and printing it next to the result.
Reading a null as a zero. A field that stops populating produces a chart that declines smoothly to nothing, which looks exactly like a real collapse in engagement. If your storage layer cannot distinguish absent from zero, you will not merely miss the change, you will manufacture a plausible business narrative on top of it.
Treating a listing as a census. A listing sorted by new returns what is currently visible in that sort, and it is subject to removal, spam filtering and moderation. Posts removed by a moderator between creation and your read are simply not there. That makes any count derived from a listing a count of what survived moderation, which is a different and generally smaller population than what was submitted. For engagement ratios this barely matters. For anything shaped like "how much spam does this community get", it matters completely, and the API is the wrong instrument.
Letting one prolific account carry a conclusion. Our overlap pass found one account posting into 45 distinct communities against a median of 6. On a sample of 18, that single account touches a quarter of every community in the tail. Any statistic computed as a raw union across accounts is dominated by whichever account is busiest, which is why the overlap table counts authors per community rather than posts per community.
Assuming a field's absence is permanent, or its presence is. This cuts both ways and it is the reason for the retrieval dates. active_user_count populated for years and now does not. It may come back. Subscriber count is present today after a period when developers openly wondered whether it would survive. Anything built here should log which fields it received, not just the values, so the shape of the response is itself a monitored signal.
What about flair, rules and wikis?
These are the signals people ask about after they exhaust the obvious ones, and each is genuinely available through the API while being weaker than it first appears.
Flair is the most tempting, because in some communities flair is close to self-reported identity: a job title, a country, an experience level. It comes back on post objects where a community uses it. The problem is that flair is per-community, non-standard and optional, so it does not aggregate. A country flair in one community and an experience-level flair in another cannot be combined into anything, and communities that use flair heavily are a self-selected minority. Flair is best treated as a rich signal about one community that you read manually, rather than a field you pipeline.
Subreddit rules tell you about the community's posture rather than its people, and they are more useful than they look for audience work, because they tell you what a community will tolerate. A community that bans self-promotion outright is one where a certain kind of participation is not available at any budget, and that is a targeting fact even though it is not a demographic one. We have covered reading the rules surface programmatically separately.
Wikis and sidebars are where communities put their own self-descriptions, and in a handful of cases their own survey results. Several large communities run periodic member surveys and publish the results in the wiki. Those are self-selected samples with all the bias that implies, but they are the only place actual self-reported demographics for a Reddit community exist at all, and they were collected by people who understood the community. One participant in the r/TheoryOfReddit discussion pointed at exactly this practice:
"Usually through unofficial subreddit surveys. Like I've seen /r/MaleFashionAdvice do these surveys and the results are always the same. Nearly all male (to be expected) and white."
The honest assessment is that a community-run survey is better evidence about that community than any platform-level statistic, and worse evidence than it appears because the people who answer surveys are the people most invested in the community. If you need self-reported attributes for one specific community, checking whether it has ever run a survey is a better first move than any API call. Reading the wiki surface is a single request.
Doing this at scale without getting throttled
The measurements in this post are small: about 45 requests for the main pass and 31 for the overlap pass, roughly 76 in total. Scaling them up is mostly a question of respecting one number and designing around one constraint.
The number is Reddit's OAuth request budget, which its own Data API Wiki describes as a per-client allowance rather than an unlimited stream. Working from 100 requests a minute, the daily ceiling is 144,000 requests, and a portfolio of 20 communities polled every 15 minutes plus a daily about snapshot comes to 1,940 requests a day, which is 1.35% of it. Audience analysis is simply not a high-volume workload. The expensive proxy is overlap, and even resolving every author of every page across 20 communities lands in the low thousands. If you are anywhere near a limit, the cause is almost certainly a retry loop rather than the analysis itself. Our own breakdown of the current limits has the detail, and what a throttled response actually looks like covers handling it.
The constraint is that none of this works unauthenticated. While writing this post we requested three subreddit about records directly from the public web endpoint with an ordinary browser user agent, and all three returned HTTP 403. Not a rate limit, not a challenge page: a refusal. That is the practical reason an audience-research pipeline needs a token rather than a fetch loop, and it is a change from the era those older tutorials were written in.
Two design choices make the difference between a pipeline that survives and one that needs babysitting:
- Request compression and mean it. Every measurement here used gzip, and the saving is not marginal: a 100-post listing came back as 55,622 bytes on the wire against 190,355 decoded, which is 70.8% saved. The trap is that asking for compression and not decoding it produces bytes that parse as garbage rather than raising an error, which reads like a broken API for as long as it takes you to check the
Content-Encodingheader. - Store the raw payload, at least for a while. Every derived figure in this post was recomputed from stored responses rather than from a live call, which is what made it possible to check the AutoModerator hypothesis without re-fetching. A pipeline that stores only its computed metrics cannot answer a new question about last month.
How to run these measurements yourself
Everything above is four endpoint shapes. Here is the about record, which is where the null shows up:
curl -sS "https://api.redditapis.com/api/reddit/sub/redditdev/about" \
  -H "Authorization: Bearer $REDDIT_APIS_KEY" \
  -H "Accept-Encoding: gzip" --compressed
The response carries subscribers, created_utc and active_user_count. Read the third one and check whether it is null before you store it.
The listing call is where the behavioural proxies come from:
curl -sS "https://api.redditapis.com/api/reddit/posts?subreddit=Python&sort=new&limit=100" \
  -H "Authorization: Bearer $REDDIT_APIS_KEY" \
  -H "Accept-Encoding: gzip" --compressed
And here is the activity histogram with the bot filter applied, which is the whole correction from the r/Python section in about fifteen lines:
import collections, datetime, os, requests

KEY = os.environ["REDDIT_APIS_KEY"]
BASE = "https://api.redditapis.com"
AUTOMATION = {"AutoModerator"}

r = requests.get(
    f"{BASE}/api/reddit/posts",
    params={"subreddit": "Python", "sort": "new", "limit": 100},
    headers={"Authorization": f"Bearer {KEY}"},
    timeout=60,
)
r.raise_for_status()
posts = r.json()["posts"]

stamps = [p["created_utc"] for p in posts]
window_h = (max(stamps) - min(stamps)) / 3600
print(f"{len(posts)} posts spanning {window_h:.1f} hours")

hours = collections.Counter(
    datetime.datetime.fromtimestamp(p["created_utc"], datetime.timezone.utc).hour
    for p in posts
    if p["author"] not in AUTOMATION
)
print("peak UTC hour, automation removed:", hours.most_common(1))
Two lines in that snippet are the ones that matter. Printing the window before the histogram means you always know what period you sampled, so you can never accidentally compare 16.6 hours against 110 days. And filtering AUTOMATION before bucketing is what moved r/Python's peak by twelve hours.
For account-age cohorts, resolve the authors you already have:
import time

authors = []
seen = set()
for p in posts:
    a = p["author"]
    if a not in seen and a not in AUTOMATION and a != "[deleted]":
        seen.add(a)
        authors.append(a)

ages = []
for a in authors[:25]:
    u = requests.get(
        f"{BASE}/api/reddit/user/{a}",
        headers={"Authorization": f"Bearer {KEY}"},
        timeout=60,
    )
    if u.status_code == 200:
        ages.append((time.time() - u.json()["created_utc"]) / 31_557_600)

ages.sort()
print(f"{len(seen)} distinct authors in {len(posts)} posts")
print(f"median account age: {ages[len(ages)//2]:.2f} years")
Note the if u.status_code == 200 guard. A deleted or suspended account will not resolve, and silently skipping those is fine as long as you report how many you skipped, which is why the table above carries both "profiles sampled" and "profiles resolved" as separate rows.
The whole pass behind this post is smaller than people expect:
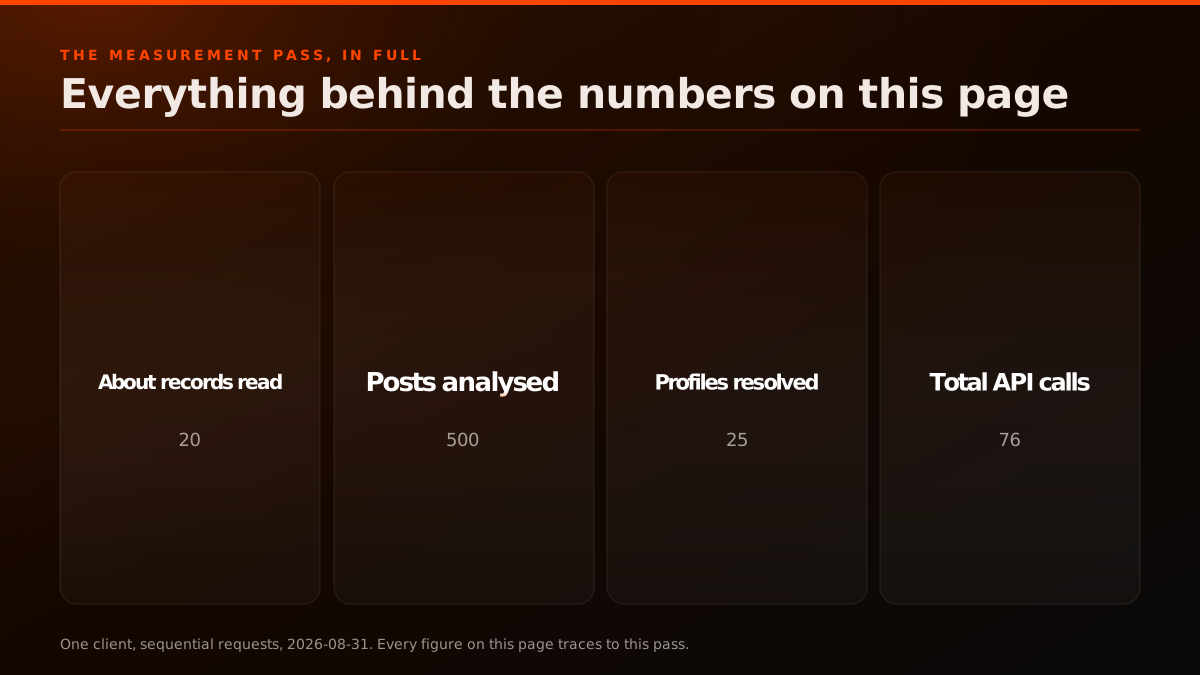
Twenty about records, five listing pages totalling 500 posts, 25 profile lookups and a 31-call overlap pass come to 76 requests. That is the entire evidence base for this article, and it is small enough to re-run while reading it, which is the point: none of this requires scale, it requires knowing which field to distrust.
The full endpoint reference is in the documentation, and if you have not set up authentication yet, the OAuth walkthrough covers getting a token. Everything in this post is public data read through the standard listing and about endpoints, at a request volume that sits comfortably inside any tier.
What this means if you are sizing a Reddit audience
The practical answer is to stop looking for demographics and start measuring fit, because fit is what the API can actually support and it is closer to the decision you are making anyway.
A marketer asking "who is on Reddit" is usually asking a narrower and more answerable question: is my audience in this community, and is that community alive enough to be worth the effort. Both halves are measurable. Alive is post velocity, distinct authors and comments per upvote, all of which come from one listing page. Fit is cross-community overlap, which you get by resolving the authors of a community you know converts and checking where else they post.
This is where a hosted API earns its place over a scraper, and it is worth being specific rather than promotional about why. The volume here is small: the entire dataset in this post is about 45 requests. The reason to use an API rather than fetch pages yourself is that Reddit blocks unauthenticated automated access outright, which we confirmed while writing this by requesting three about records directly and receiving HTTP 403 on all three. That is not a rate limit you can wait out; it is a closed door. We have written up the state of the public JSON endpoints and what scraping Reddit involves now if you want the longer version.
For the mechanics of turning these proxies into something you watch over time rather than read once, the companion to this post walks through building a subreddit analytics dashboard from the API, including the storage schema and the polling cadence each of these metrics needs. If you want the shortcut of a ranked list rather than a build, the most active communities by API-measured size is the hub this post sits under, and the comparison of hosted subreddit analytics options covers what you can buy instead of build, and Reddit data for market research covers what that data is worth now that AI search cites Reddit less.
Practitioners run into the collection problem before they run into the analysis problem, and the frustration is real. One researcher put it plainly in r/redditdev:
"This is publicly visible data that literally anyone can read by opening Reddit. But collecting it systematically for actual academic research? Impossible apparently."
The data being public and the data being collectable have come apart, and that gap is the actual product category. It is also why every number in this post carries a retrieval date: on a surface changing this fast, an undated figure is a guess about the past.
What changed between 2023 and now
A lot of the Reddit audience-research advice still circulating describes a platform that no longer exists, so it is worth stating the current position plainly rather than leaving readers to date it themselves.
Before 2023 the working answer to most of these questions was a bulk archive. You pulled historical Reddit data in volume, computed whatever you wanted offline, and the API was for live reads. That route narrowed considerably, and the archives that remain have their own access conditions, which is why so many older tutorials open with a step that no longer works. We keep a current view of what replaced the old bulk archives because it is the single most common stale assumption we see.
Three changes since then shape everything in this post. Access to the data API became credentialed and metered, so unauthenticated collection stopped being viable and the 403 we measured is the everyday result. Reddit began trimming the aggregate figures shown in its own interface, starting with subscriber counts in September 2025, and one of the two engagement numbers the API exposed has since gone empty. And Reddit has stated its intent to restrict new API access further and require third-party apps to move onto its Developer Platform, describing the older surface in its own words as something that "wasn't built for today's scale, automated abuse, or commercial scraping."
The direction is consistent: fewer aggregate numbers published, more of the remaining surface behind credentials, and a clearer separation between what Reddit shows a reader and what it exposes to a program. For audience research specifically, that makes derived behavioural proxies more valuable rather than less, because they are computed from primary data that has to stay available for the platform to function at all. A subscriber count can be hidden. The timestamps on public posts cannot be, not without breaking Reddit.
That is the case for building this yourself rather than waiting for a better published statistic. The published statistics are getting scarcer, and the ones that exist were never measurements of Reddit in the first place. The migration to the Developer Platform is the other half of this story if you maintain something that depends on the older surface.
Verdict
Reddit demographics, as the phrase is normally used, are not obtainable from Reddit. Every age and gender figure in circulation is a survey estimate about a sampled population, frequently misread on the way to publication, and the most common misreading inverts the direction of the statistic entirely.
What the public API gives you instead is behavioural and genuinely useful once you accept the swap. Community size is solid. Activity rhythm works and needs a bot filter, without which r/Python's peak hour is wrong by twelve hours. Account-age cohorts are the one real cohort variable, and in r/SaaS the median poster's account is under a year old. Engagement shape separates communities that subscriber counts make look identical, by up to 3.8x on comments per upvote. Cross-community overlap is the strongest fit signal and the most expensive to compute.
And one field that used to work no longer does. active_user_count returned null in 20 of 20 communities we queried, every request answering HTTP 200, corroborated independently by developers hitting the same absence through PRAW. If your pipeline reads that field, check what it has been storing.
The honest summary is that you can learn a great deal about a Reddit community and almost nothing about a Reddit user. Most of the value in this space is in being clear about which one you have, and stating the window and the sample size next to every number you publish.
You can run every measurement in this post against the documented endpoints on any plan, or sign up and reproduce the whole pass in an afternoon. If you do, and active_user_count returns a number for any community, that is a finding worth having: it would mean the field is coming back, and this post would need updating.
Where these numbers come from.
Each row is a figure in this post and the artefact it was read from. Reddit's access rules and the third-party archives around them keep moving, so check the date on a source before you build against it.
- Reddit Data API documentation
- The endpoint reference for listings, about records and user profiles. Confirms which fields a user object carries. Retrieved 2026-08-31.
- Reddit Data API Terms
- Governs programmatic collection of public Reddit data. Retrieved 2026-08-31.
- Reddit Data API Wiki
- Reddit's own description of the request budget applied to OAuth clients. Retrieved 2026-08-31.
- AttributeError: Subreddit object has no attribute active_user_count
- Third-party corroboration that the active-user field stopped populating, reported by developers hitting it through PRAW. Dated 2025-09-18.
- Is subscriber count staying in the subreddit-related endpoints?
- Developer question raised after Reddit removed visible subscriber counts from parts of its interface. Dated 2025-09-10.
- Are weekly visitor and contributor counts available in json or API?
- Establishes that the visitor and contributor figures shown in moderator tooling are not exposed through the public API. Dated 2025-10-02.
- Our plans for the future of Reddit's public data
- Reddit staff statement on restricting new API requests and porting third-party apps to the Developer Platform.
- Pew Research Center, Social Media and News Fact Sheet
- The survey source behind most published Reddit age brackets, and the source whose table is most often misread. Retrieved 2026-08-31.
- Predicting Age Groups of Reddit Users Based on Posting Behavior
- Peer-reviewed work training a classifier on public API fields to predict age group, reporting F1 0.78 and stating its own generalisation limits.
- PRAW documentation
- The Python client whose attribute surface mirrors the API response shape. Retrieved 2026-08-31.
Frequently asked questions.
No. The public Reddit data API has never exposed self-reported age, gender, income or location on a user object, and it does not in 2026. A user profile returns the account name, its creation timestamp, karma totals and a handful of status flags such as verified and is_mod. Every age or gender percentage in a published Reddit statistics article is therefore a third-party estimate from a survey panel, most commonly Pew Research Center or a commercial panel resold through an aggregator, and not a figure Reddit gave anyone. See what the API returns about a user.
Because the field stopped populating. We queried the about record for 20 communities on 2026-08-31, every request returned HTTP 200, and active_user_count came back null in 20 of 20. The field is still present in the response shape, it just carries no value. Developers reported the same disappearance in PRAW with no changelog entry, in a r/redditdev thread titled AttributeError: Subreddit object has no attribute active_user_count. Treat subscriber count as the dependable size signal and do not build a metric that assumes the live active count returns a number.
Partly, and only as a probabilistic signal. Post timestamps are returned as created_utc on every item in a listing, so bucketing 100 posts by UTC hour gives you an activity curve. That curve correlates with where a community's active contributors are awake, which is a useful proxy. It is not a location field. VPNs, night-shift workers and scheduled posts all distort it, and automation distorts it most: filtering AutoModerator moved r/Python's apparent peak hour by twelve hours in our measurement.
Subscribers is the cumulative count of accounts that have joined a community, a number that only trends upward and never decays when someone stops reading. The active-user count was Reddit's estimate of how many accounts were viewing right now, a volatile figure that moved with time of day. As of our 2026-08-31 measurement the second number is no longer available through the API: it returned null in 20 of 20 communities. That leaves subscribers as a reach figure with no engagement counterpart, which is exactly why you have to derive engagement from post listings instead.
A listing call returns at most 100 items, and how far back those 100 items reach depends entirely on how busy the community is. Measured on 2026-08-31 across five communities, the same 100-post page covered 16.6 hours in r/SaaS and 2,639.4 hours in r/redditdev, a 159x difference. That means a single polling cadence cannot serve a portfolio of communities, and a naive comparison of two communities over one page is comparing two different observation windows.
It is the most reliable number the API returns, and it is worth less than it used to be. Reddit began removing visible subscriber counts from parts of its own interface in September 2025, which prompted a direct r/redditdev question about whether the field would survive in the API at all. It is still returned today. The honest read is that subscriber count measures accumulated sign-ups rather than current audience, so it answers how many people ever joined and not how many are there now.
You measure behaviour instead of identity. Five proxies are available from the public API: community size from the subscriber count, activity rhythm from the UTC hour distribution of post timestamps, account-age cohorts from created_utc on each posting account, cross-community overlap from the same account appearing in two listings, and contribution concentration from distinct authors per hundred posts. Each is a real signal with a real error mode, and none of them is a demographic. See the companion build guide.
Yes, and by more than most analyses assume. AutoModerator wrote 31 of the 100 newest posts in r/Python and 11 of 100 in r/datascience when we measured on 2026-08-31, while writing 0 of 100 in r/SaaS, r/webdev and r/redditdev. Because AutoModerator posts on a fixed schedule, its contribution lands in one UTC hour bucket. In r/Python that bucket was 00:00 UTC, which an unfiltered histogram reports as the community's busiest hour. Filtering by author name moved the real peak to 12:00 UTC.
Sample by time window, not by post count. Because one page returns 100 items regardless of community size, a fixed post count silently samples very different periods: our 100-post pages spanned 16.6 hours in one community and 110 days in another. Decide the window you care about first, then page until you have covered it, and record how many items that took. State the window alongside every figure you publish, because two communities compared over different windows are not comparable at all.
You can collect and analyse publicly visible Reddit data. Reddit's own Data API allows it under the Data API Terms (self-service access closed in November 2025, so new keys go through Reddit's request process), and redditapis.com, used for the measurements in this guide, reads Reddit's public surface at its own risk and holds no agreement with Reddit. What you cannot do is obtain per-user demographic attributes, because Reddit does not collect most of them and does not expose the rest. Reddit's advertiser tooling offers aggregate audience segments inside its own ads product, which is a separate commercial surface with its own terms and no public API for demographic export. See the legal position on collecting Reddit data.
Keep reading.
Continue exploring related pages.
Reddit API documentation
The complete 2026 reference: auth, all 73 endpoints, and code.
Get a Reddit API key
Instant bearer token, no waitlist and no enterprise contract.
Reddit Responsible Builder Policy
Why Reddit denies API applications, and the managed REST bypass.
Reddit API use cases
14 use cases from AI training to brand monitoring and DMs.
Reddit Search API
Search posts, comments, users, and communities over one REST endpoint.
Reddit MCP server
Wrap the REST API as MCP tools for Claude, Cursor, and any MCP client.
Reddit MCP hub
Install tabs for every client, the full tool table, pricing and fixes.
Reddit API for AI agents
Live Reddit context for tool calls, MCP servers, and RAG pipelines.
Redditapis pricing
Endpoint-level costs and quick monthly totals - reads from $0.0015 / call.
Reddit API cost calculator
Estimate monthly spend using your request volume.
Reddit API guides and tutorials
Tutorials, walkthroughs, and API deep-dives for developers.
Reddit API alternatives
Evaluate alternatives by cost model, limits, and integration fit.
Cheap Reddit API
The cheapest way to get Reddit data: $0.0015 per call, no contract, no minimum.
Official Reddit API vs Redditapis
Access, setup, rate limits, and pricing, side by side.
PRAW alternative
A hosted Reddit REST API for any language, no app registration or OAuth.
Reddapi alternative
A maintained Reddit REST API with published pricing and write endpoints.
Reddit comment scraper alternative
The raw comment API: search and filter comments, historical and live, clean JSON.
Reddit scraper API
Hosted scraper API vs building your own: no proxies to manage, clean JSON.
RapidAPI Reddit alternative
A direct, maintained Reddit API with published pricing and write endpoints.
Bright Data Reddit alternative
A purpose-built Reddit API vs a general scraping platform: structured JSON, plus writes.
ScraperAPI Reddit alternative
A Reddit-native API vs a generic HTML fetcher: auth and pagination handled, typed JSON.
TikHub alternative
TikHub's Reddit surface is read-only; get comment, vote, and DM endpoints too.
EnsembleData alternative
No $100/month floor: pay per call from $0.0015, plus write, vote, and DM endpoints.
Scrape Creators alternative
7 read-only Reddit endpoints vs a dedicated API with real write, vote, and DM paths.
FetchLayer alternative
Posts, comments, and search only; add vote, comment, and DM over the same REST auth.
PullPush alternative
PullPush is free but volunteer-run and goes offline for reindexing; a maintained REST API that stays up.
Reddit monitoring API
Build your own keyword and brand-mention monitor: search, comment search, and subreddit streams over REST.
F5Bot vs Redditapis
F5Bot's Slack and Discord delivery needs its $49.99/mo Gold tier; Redditapis includes it from $19/mo.
Syften vs Redditapis
Syften caps you at 100 to 500 results a day; Redditapis allows 10,000 a day per monitor at the entry plan.
Octolens vs Redditapis
Octolens meters by mention with overage fees; Redditapis is flat-priced by subreddit slot from $19/mo.
Affiliate program
Earn 20% lifetime commissions - capped at $5,000/yr.
Reddit Vote API tutorial
Upvote and downvote a post programmatically via the REST API.
Reddit Data API: REST, no PRAW
REST endpoints for Reddit data with no PRAW and no OAuth dance.
Reddit scraping benchmarks
Real throughput, error rates, and cost benchmarks for Reddit scraping.
Reddit API answers
Direct answers on cost, access, rate limits, endpoints, and auth.
How much the Reddit API costs
Per-call pricing from $0.0015 a read, with $0.50 in free credits.
Reddit API in Python
One requests call with a bearer token, no PRAW and no OAuth flow.
Reddit shadowban checker
Check if a Reddit account is shadowbanned in seconds, free and no login.
Subreddit stats checker
See any subreddit's live subscriber count, active users, and age, free and no login.
Similar reads.
More guides on the Reddit API, scraping, pricing, and MCP servers.

The Subreddits AI Agent Builders Actually Use: 24 Communities, Measured
Five curated lists rank the best subreddits for AI agent builders and none of them measured anything. We pulled 24 communities and 2,400 posts and ranked them on data.

Building a Reddit Dataset From the API: What You Get That a Static Dump Does Not
The public archives ship monthly. We measured what one live call returns instead: 1,000 posts across ten communities, 22 fields each, a median newest record 12 minutes old, and 496 of those rows already changed 11 minutes later.

What It Actually Takes to Post on Reddit: Karma and Account-Age Requirements Across the Top Subreddits, Measured
We read the published rules of 100 of Reddit's most popular communities. Six state a posting threshold you can read in advance. Here is every number we found.

Build Your Own Reddit Analytics Dashboard From the API: Subreddit Analytics Without a Third-Party Tool
Which endpoints to poll, how often, what to store, and how to compute the five metrics that matter. With measured latency, payload sizes and a call budget from a live pass.

Reddit's API Returns 403 From GitHub Actions: A Customer's Report and What We Verified
A redditapis.com customer reported Reddit's own API returning 403 from GitHub Actions runners with no OAuth path available. What we verified independently, and what still works.

Reddit Comment Search API: the Camas and Pushshift-Live Alternative (2026)
Reddit's API has no comment-search endpoint, its type=comment mode returns parent posts, not comment bodies. Here is why, what died with Camas and Pushshift, and how to search Reddit comment bodies by keyword over REST in 2026.

Your Request Has Been Rate Limited on Reddit: Why It Happens and How to Fix It
What Reddit's 'Your request has been rate limited' error means in 2026, why regular users and developers hit it, and the two-track fix ladder for each.

Reddit RSS Feeds vs the Reddit API in 2026
What the free Reddit .rss path still returns in 2026, its hard structural limits, where Reddit now throttles it, and when to move from RSS feeds to the managed API.